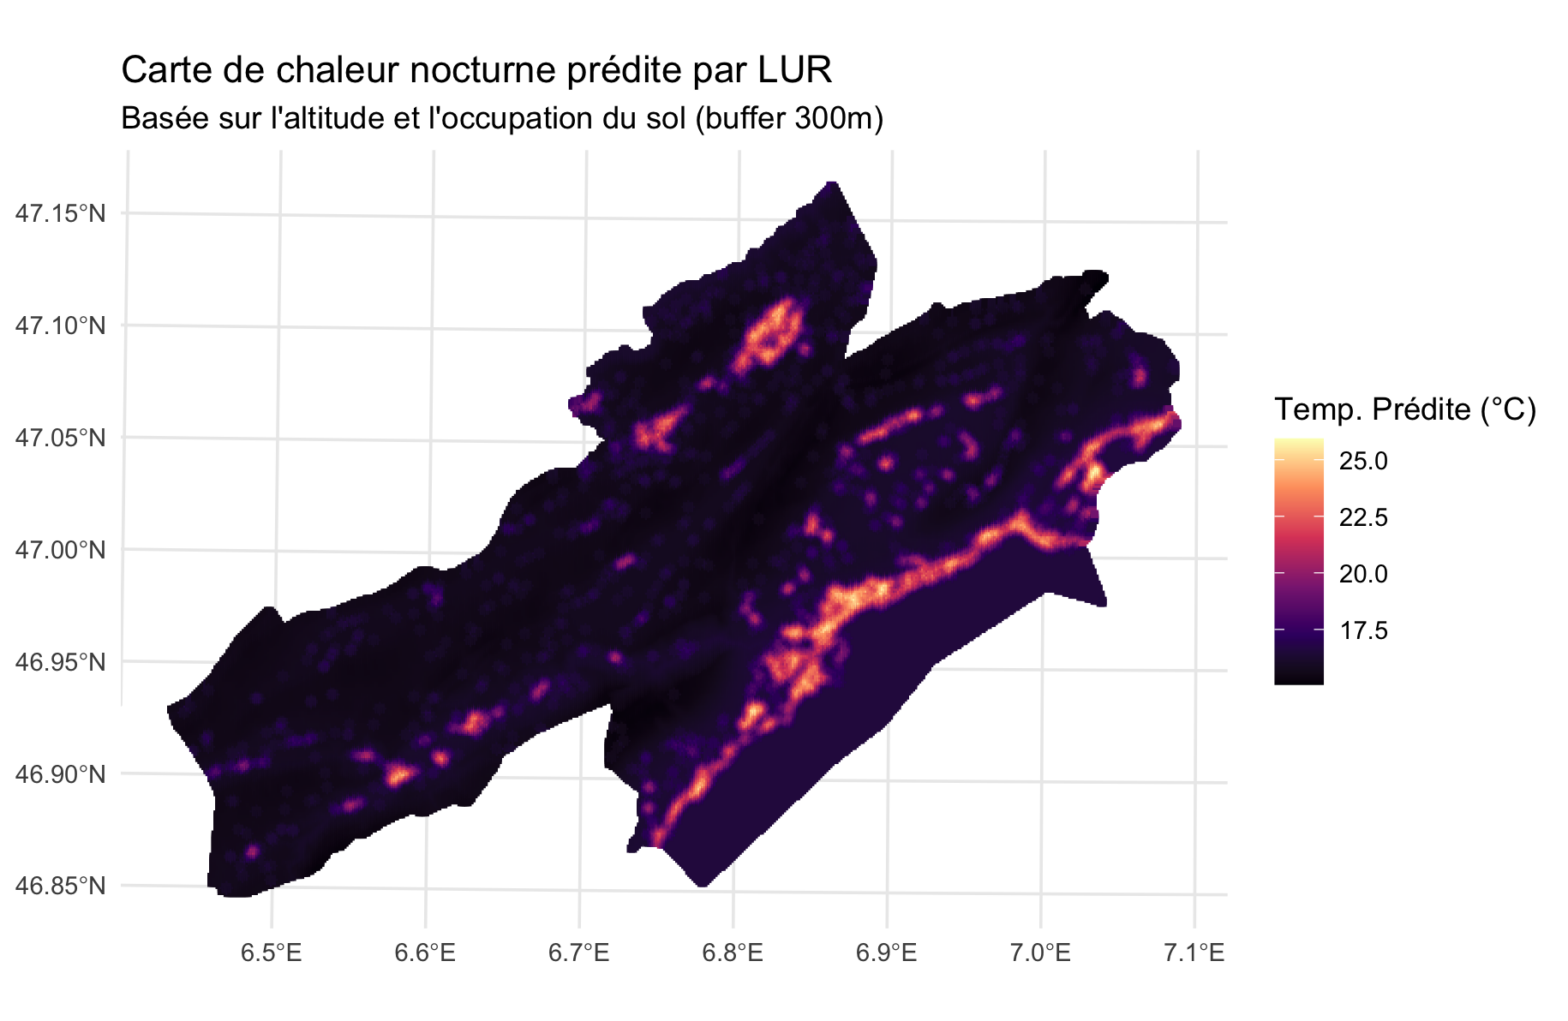
La modélisation par régression de l’occupation des sols (Land Use Regression, LUR) cherche à prédire les valeurs locales d’une variable à partir de caractéristiques environnementales mesurées dans des zones tampons (buffers) autour du lieu de prédiction. La LUR permet de créer des cartes de chaleur (heatmaps) à haute résolution des valeurs de la variable prédite. […]
Tag Archives: R
Statistiques zonales et autres agrégations de géodonnées (Qgis, GDAL, R)
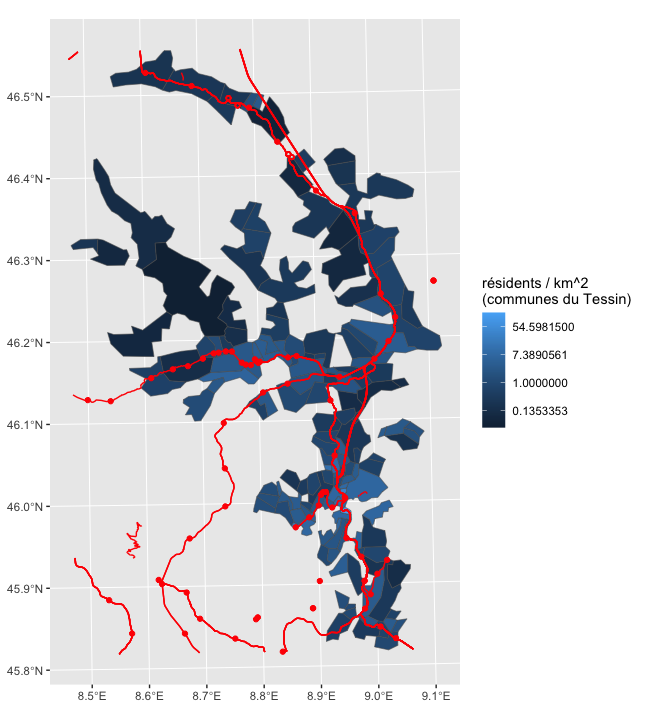
L’objectif de cet exercice est d’apprendre les rudiments de l’agrégation de données en géomatique. Nous agrégerons des données vectorielles ponctuelles dans des zones (polygones), puis nous apprendrons à générer une statistique zonale à partir de données raster. Nous verrons aussi comment préparer les données raster pour rendre une statistique zonale possible. Données de test et […]
Topic Modeling: la modélisation thématique avec R, Quanteda… et ChatGPT

Ce tutoriel présuppose que vous avez fait vos premiers pas avec le module R Quanteda et que vous maîtrisez les notions stemming, stopwords, matrice document-terme, etc. On part du principe que vous avez installé et activé les modules quanteda, quanteda.textstats, quanteda.textplots, readtext, seededlda et magrittr. Créez un corpus de textes à partir de données existantes […]
Analyse de séries temporelles avec R
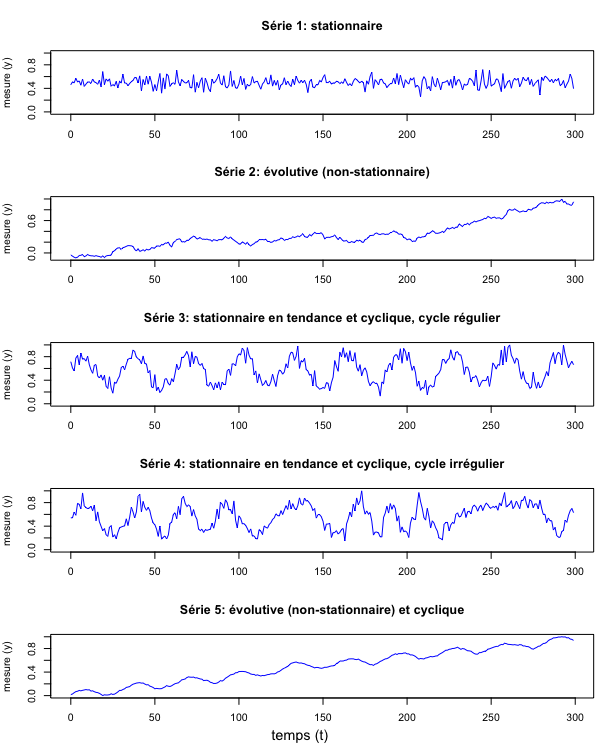
Une “série temporelle” est une suite d’enregistrements d’une variable faits au cours du temps. Cette variable peut être la température, la fréquence d’accidents routiers ou l’amplitude du son enregistré par un microphone. Les mesures peuvent être prises à des intervalles réguliers ou pas. Pour avoir une base de discussion, préparons d’abord quelques données fictives. Ne […]
Cartographie et géomatique avec R (2024)
Deux modules R principaux servent aujourd’hui pour le traitement de données géomatiques: Pour comprendre ces modules R en détail, je vous recommande l’excellente documentation de Timothée Giraud & Hugues Pecout. Le présent exercice vise à vous familiariser avec les éléments de base de la cartographie vectorielle avec R. Le prérequis pour comprendre les instructions ci-dessous […]
Text2Landscape: Visualize a Text in Multiple Spaces with R — Force-directed networks, Biofabric, Word Embeddings, Principal Component Analysis and Self-Organizing Maps
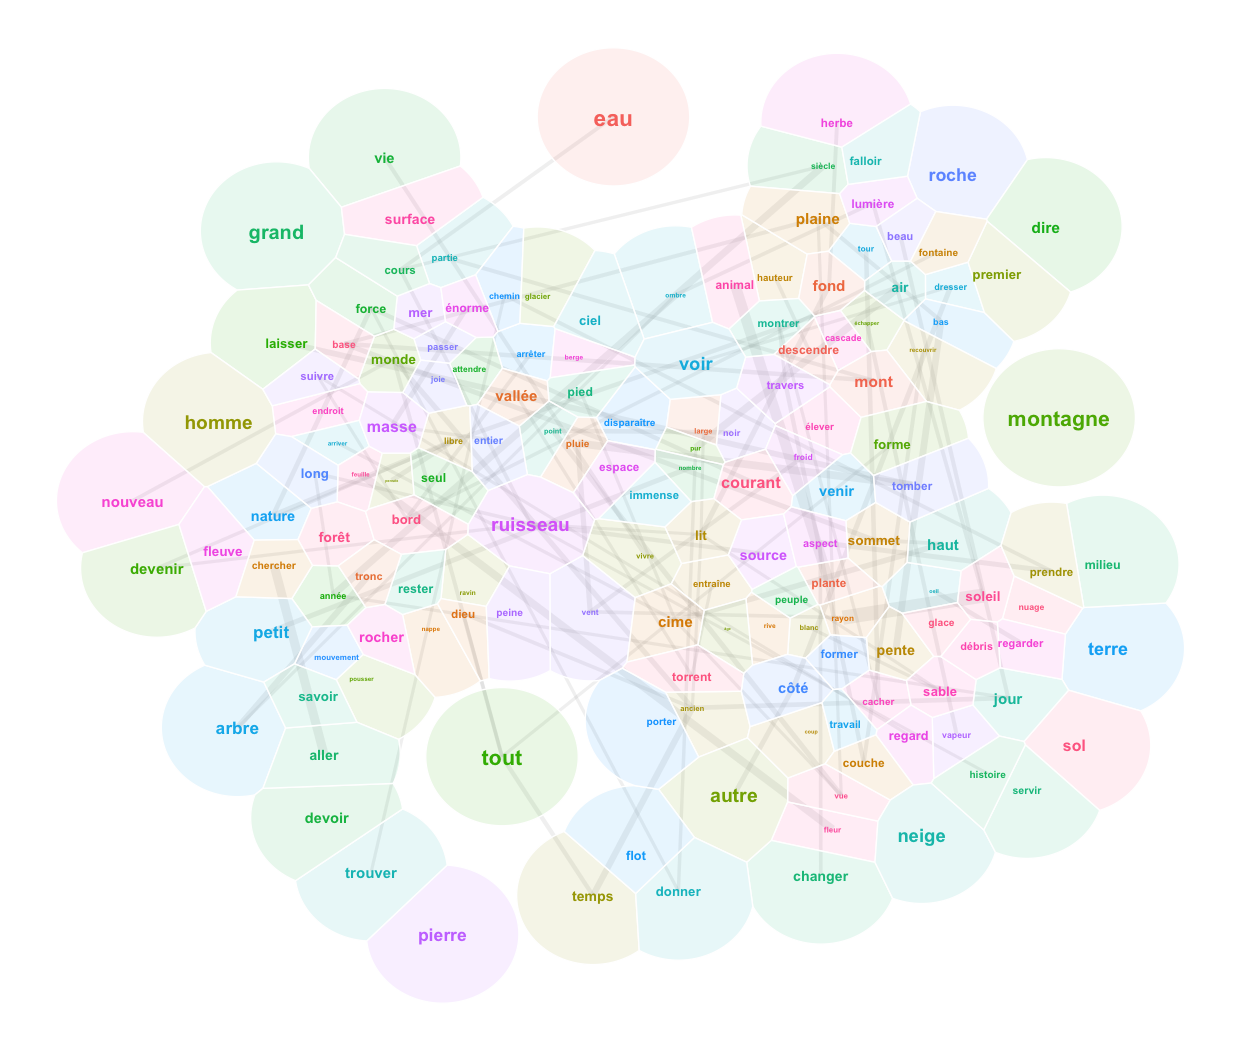
You will find no realistic landscapes prior to the Renaissance. The saints of medieval murals float in a conceptual space informed by hierarchies and symbolic relations; so do those of the Prajñāpāramitā Sūtras. The word “landscape” appears with the Dutch painters of the 15th century. A landscape is a part of the world perceived by […]
Execute SPARQL chunks in R Markdown
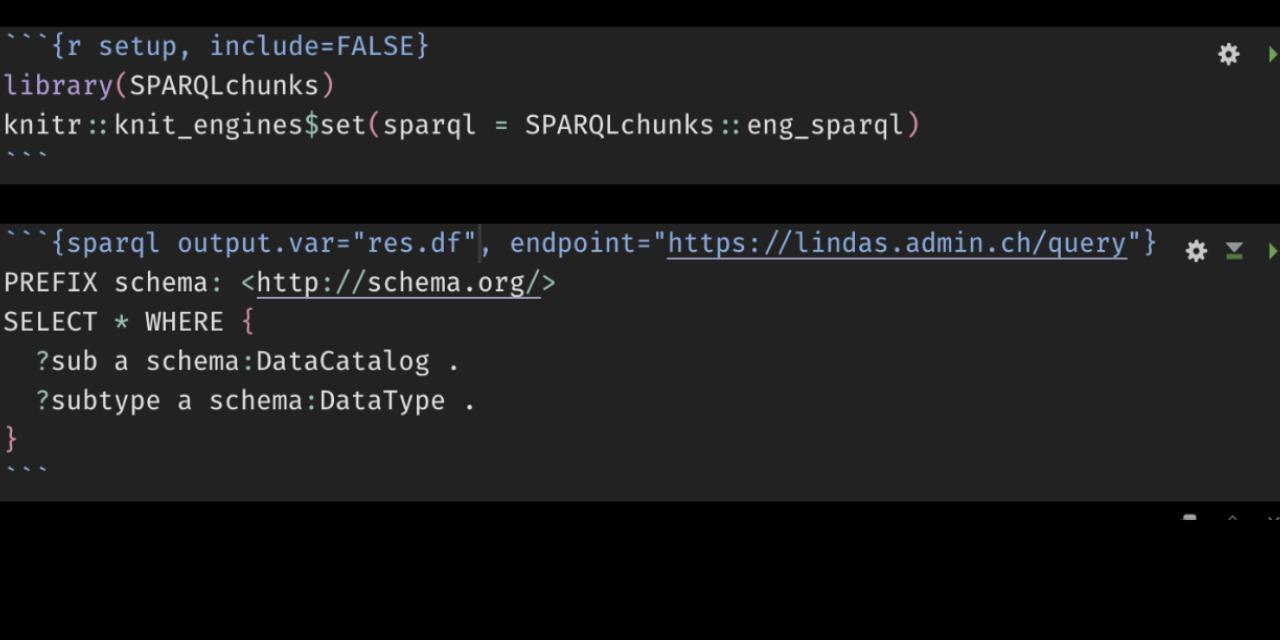
Coding in R is useless without interesting research questions; and even the best questions remain unanswered without data. RStudio provides a number of convenient ways to acces data, among which the possibility to write SQL code chunks in Rmarkdown, to run these chunks and to assign the value of the query result directly to a […]
Premiers pas avec le module R “Quanteda” pour l’analyse linguistique
Cet exercice a pour but de vous familiariser avec le module Quanteda pour l’analyse linguistique. Il présuppose que vous avez fait les premiers pas avec R et Rstudio. Installez et activez les modules Installez les modules quanteda, quanteda.textstats, quanteda.textplots, readtext, ggplot2 et udpipe: Créez un nouveau script R pour sauvegarder la progression de votre travail. […]
Radar charts with R

Radar charts, also called spider charts, serve to compare profiles of individuals. They are most useful if every profile is compared to an average profile. They are most pertinent when the order of the axis has an inherent sense, such as cardinal directions, the surroundings of an individual (the level of noise from left, right, […]
Workshop Poliphilo 2 : première partie

Ceci est la seconde édition du workshop créé par l’auteur pour le laboratoire d’architecture ALICE (EPFL-ENAC) dans le cadre du projet de recherche et d’enseignement POLIPHILO. Le premier workshop demeure disponible en ligne. Première partie Dans cette première partie, nous allons étudier les diverses relations spatiales entre les lieux. Vos données Pour la suite de […]