La nature est ce qui dépasse toutes les structures et les projets. Elle s’étend au-delà des remparts de la ville; au-delà des barrières qui nous séparent de l’inconscient. La nature est ce qui ne peut être déterminé, car elle naît d’elle-même et se détermine elle-même. La nature est la zone du dehors. Tourner un documentaire […]
Category Archives: Spaces
Cartes et continuités
J’aime, dans les cartes, l’illusion de continuité qu’elles procurent. Cette idée de distance à vol d’oiseau qui nous fait oublier que nous sommes des animaux sans ailes ; lestés au sol, voués à tracer nos vies en suivant les aspérités du terrain. Les courbes de niveau ne laissent deviner qu’une infime partie des obstacles. La […]
L’agence fédérale ICE détournée comme outil de répression domestique? – un regard cartographique
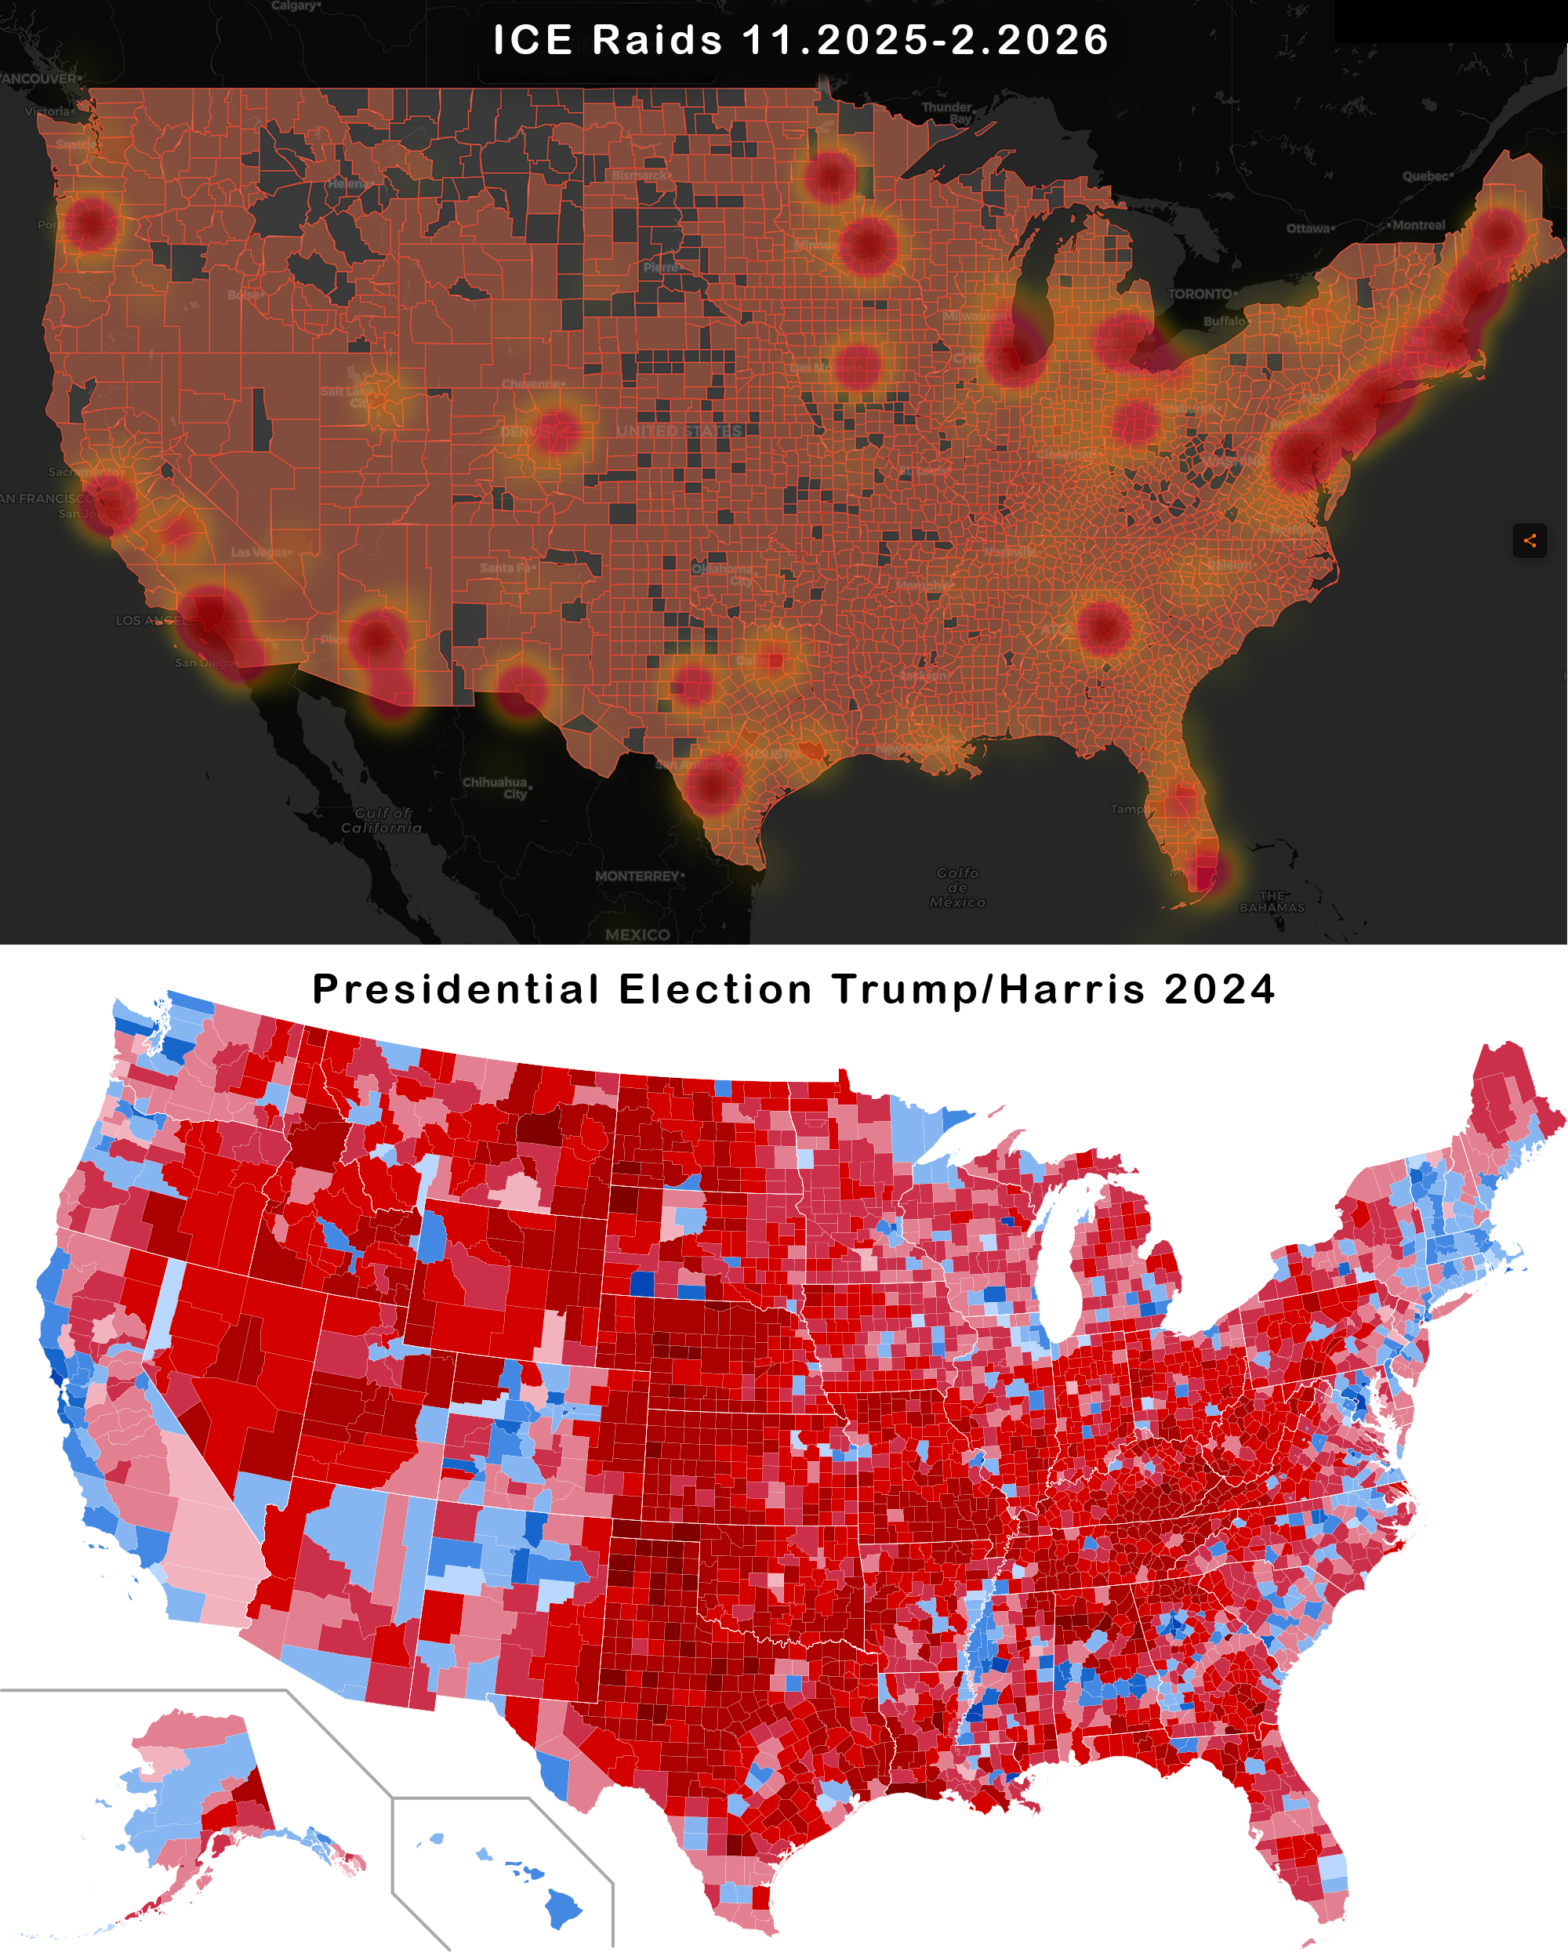
L’agence fédérale ICE, aux USA, mène actuellement une campagne de déportation voulue massive. Ses effets concrets suggèrent toutefois que son but serait aussi, voire surtout, d’intimider les opposant·e·s politiques du président Trump. Une comparaison des cartes électorales avec celle des activités ICE corrobore cette hypothèse. Notons en préambule que la carte est compilée à partir […]
OuroborosTree : Visual Data Exploration for Biosphere-Conscious Nutrion
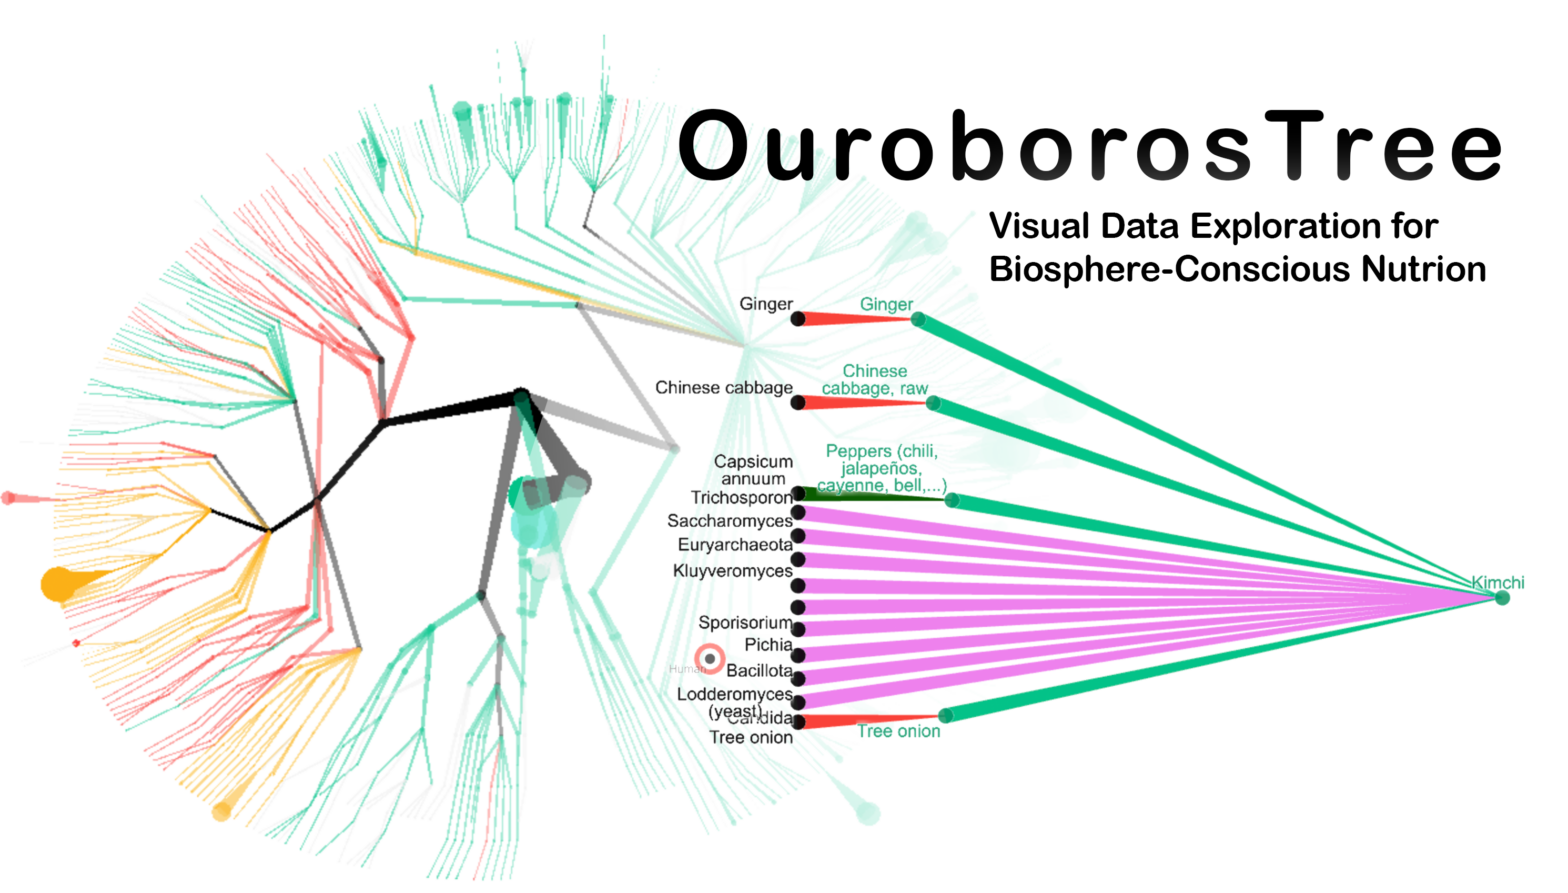
OUROBOROS TREE is a visual application for exploring relations between human nutrition and living organisms. I have built it because many contemporary issues can be addressed through a prism of our relationship with “non-humans” (according to Bruno Latour’s terminology). The project is evolving and welcomes feedback from the public. OurobosTree harmonizes, for the first time, […]
The exponential line of technological progress… really?
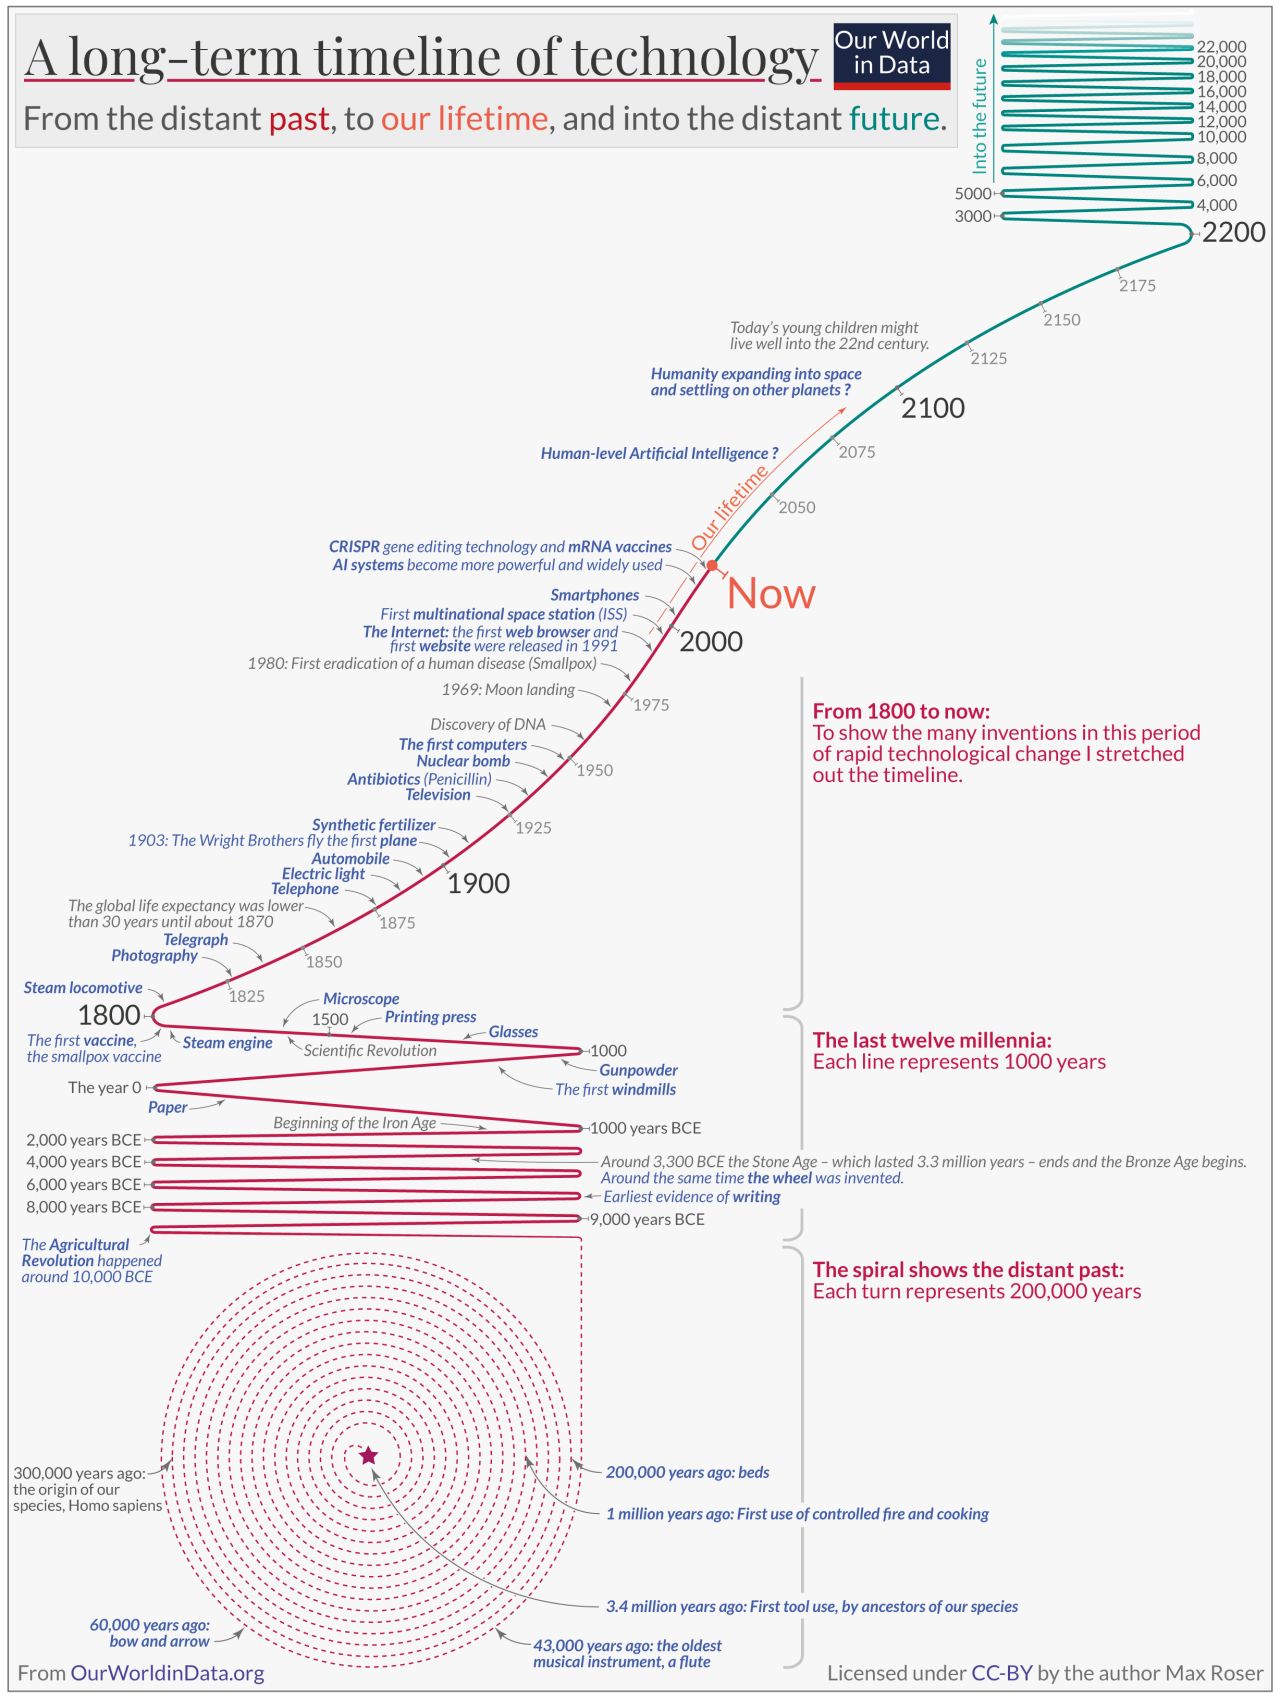
A couple of days ago, I stumbled on LinkedIn on this image showing a long-term timeline of technological development by Max Roser, founder of Our World in Data. The graphic is impressively synthetic, and deals beautifully with exponential time scales, both prior and after the modern epoch. But I am not convinced that the evolution […]
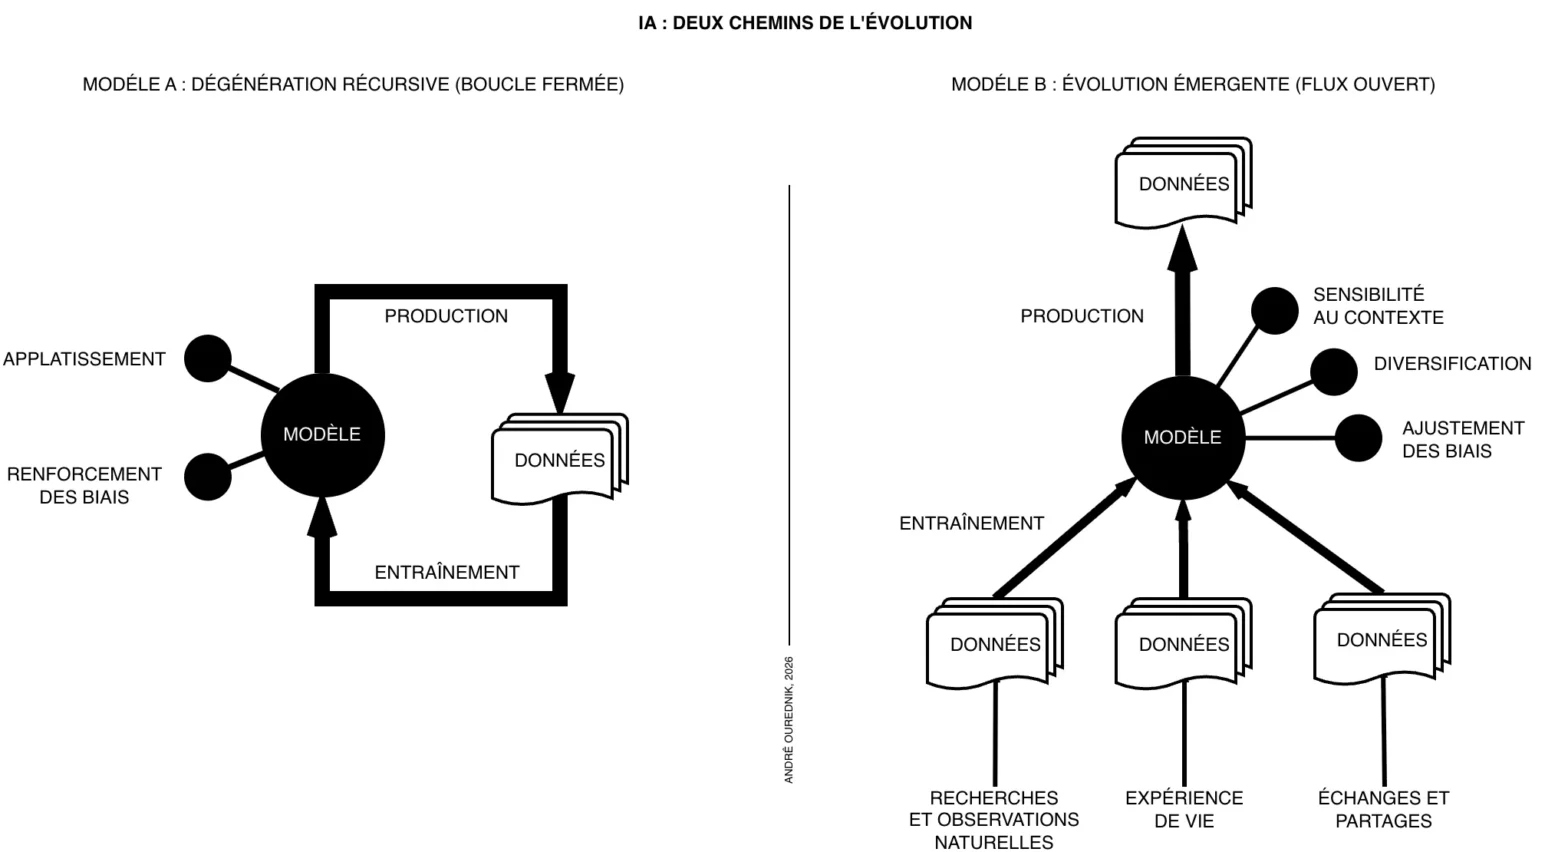
Domaine de l’IA et domaine humain: pensée totalisante et pensée itinérante
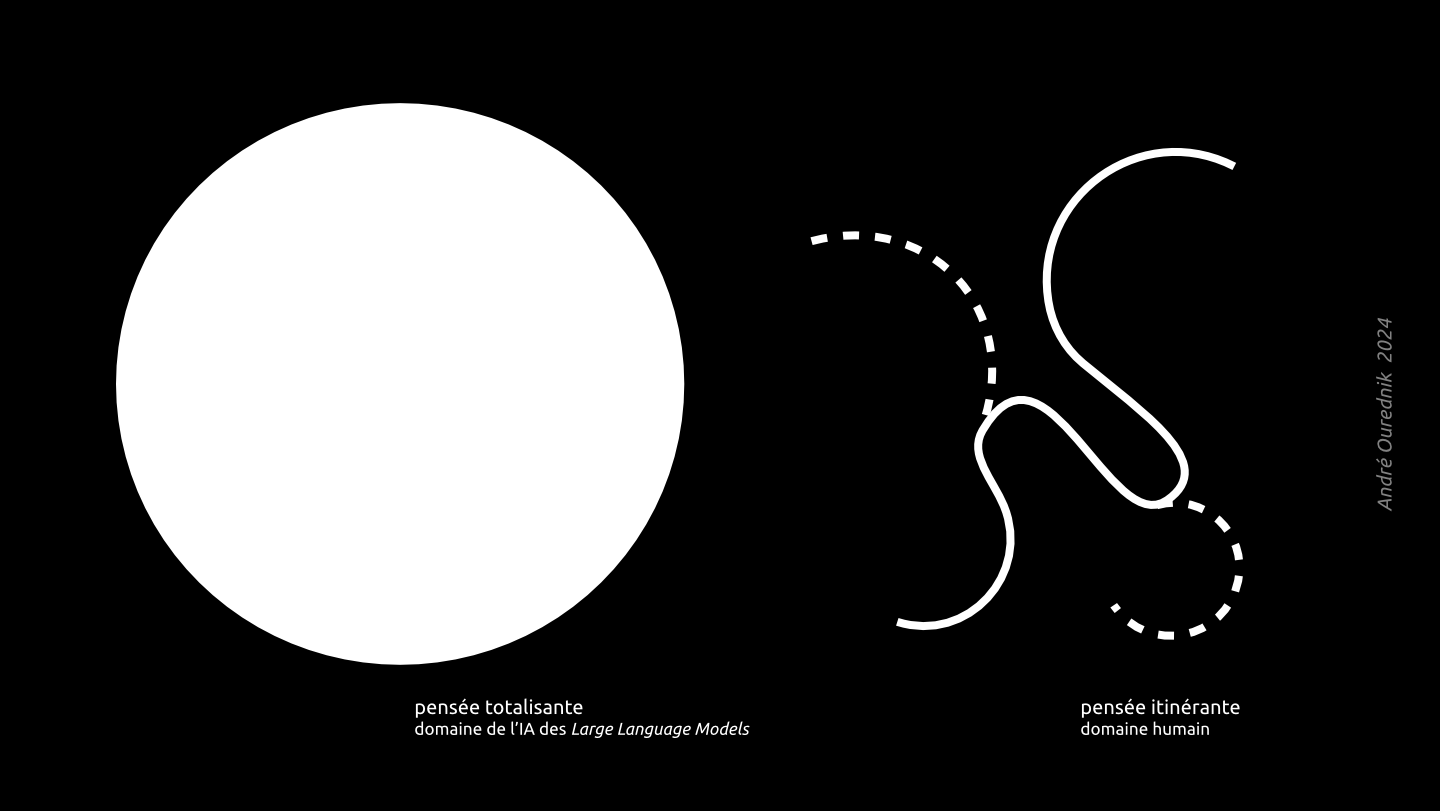
Notre Journée pédagogique, organisée par le programme SHS de l’EPFL, a donné lieu à de riches débats au sujet des enjeux de l’IA dans l’enseignement. Si les sciences de la nature, de l’architecte et de l’ingénieur·e posent déjà d’excellentes questions déontologiques et écologiques dans ce domaine, l’apport des sciences humaines et sociales est multiple et […]
Comptons avec au moins 30% de population résidente Suisse en plus d’ici 2055
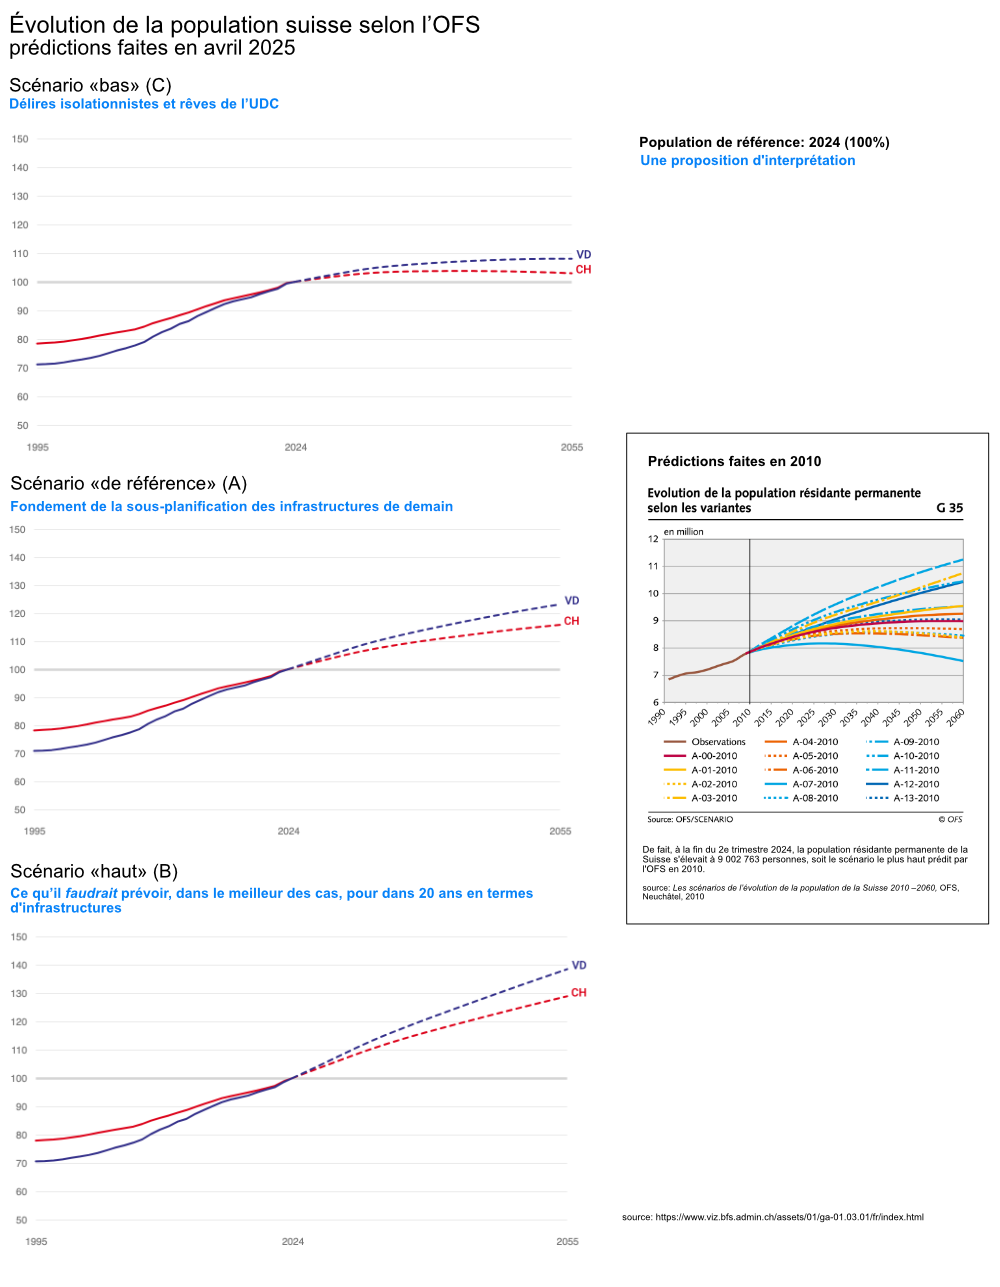
L’Office fédéral de la statistique (OFS) vient de publier ses nouveaux scénarios de l’évolution démographique. Ils me rappellent ceux que j’ai vus lorsque je finissais ma thèse de doctorat en géographie en 2010. À l’époque, j’étais déjà surpris d’entendre l’office nous dire que “la croissance démographique continuera telle quelle, ou alors elle s’arrêtera, ou alors […]
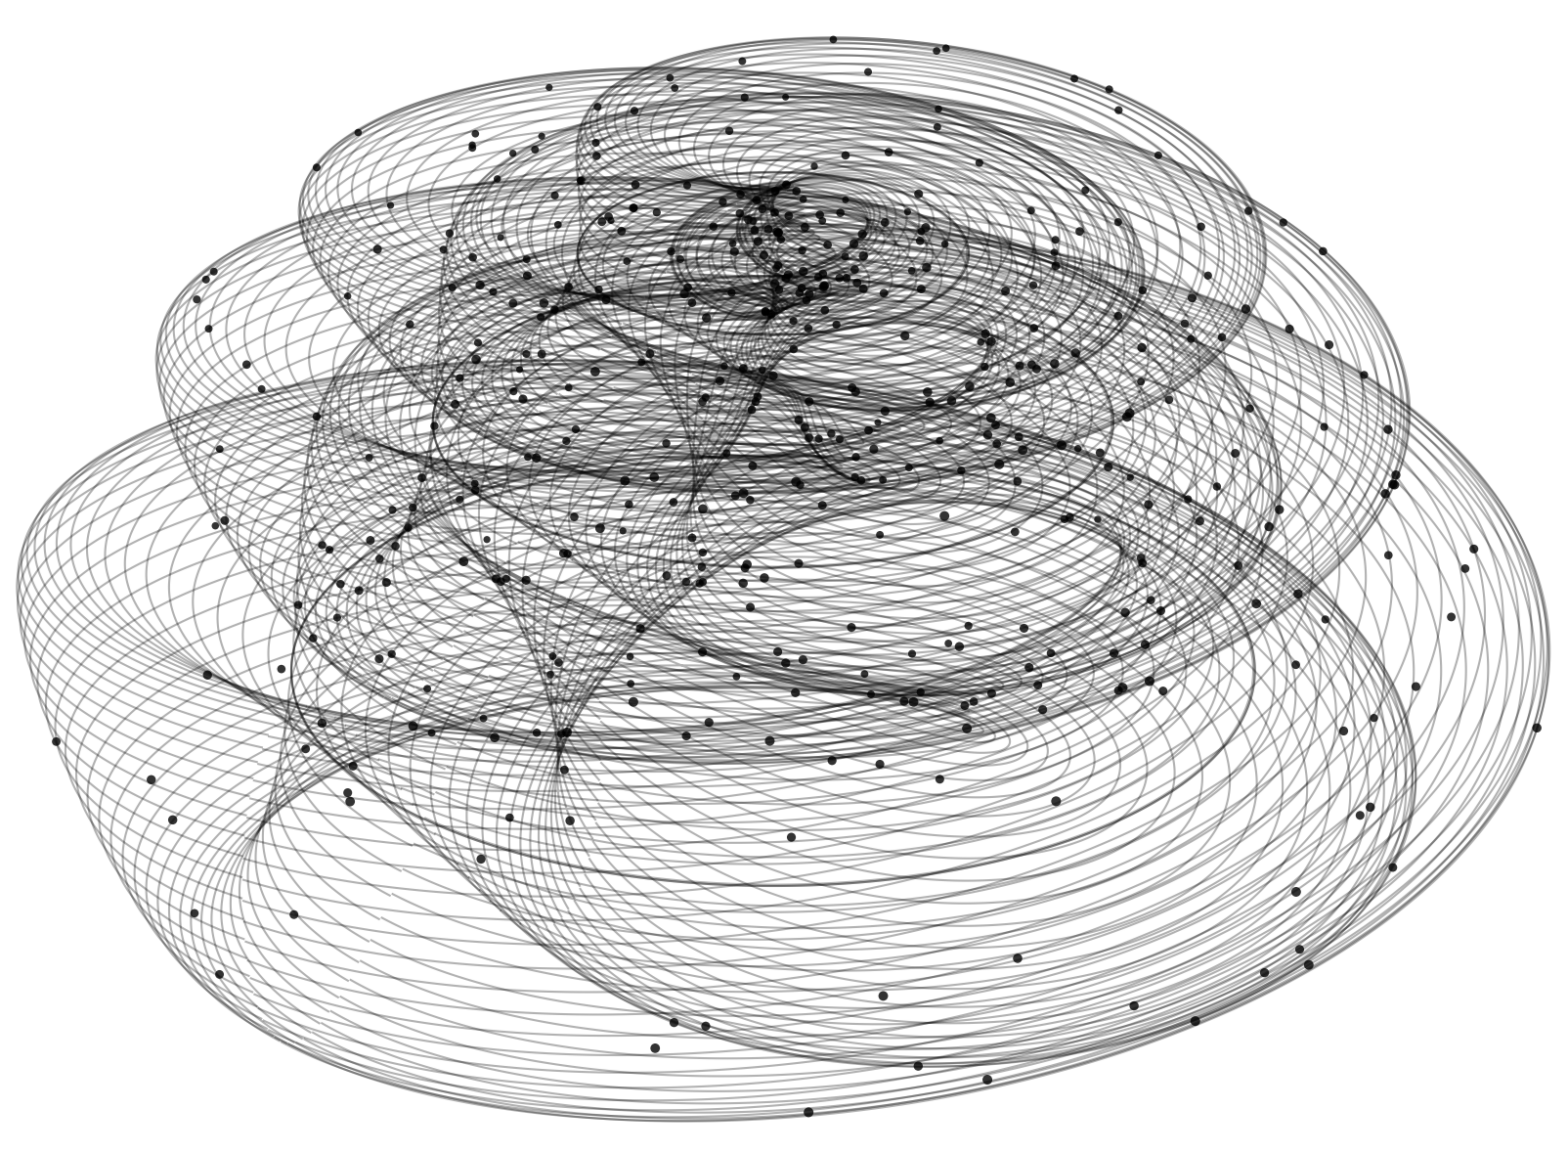
Winding Paths in the Space of Conflicts

I rarely travel by plane but, when I do, I can’t help checking that little screen of bad LEDs at least five times an hour, to see the map of locations miles below. Many of them I’ve never heard of, and most of them I’ll never see. Their names appear on the screen like as […]
Division by Zero – Sometimes Usefull

“Zeroworld“, a recent episode of the WNYC podcast Radiolab, examined the possibility of division by zero. The discussion turned mostly metaphysical and got many listeners so angry that they went on to rant on Reddit. I understood this episode more as a fun thought experiment than as a formal proposal. But it also reminded me […]
Figures and Maps of Concepts

This blog entry is work in progress… Please be patient, more content is comming soon. Meanwhile, you can read other posts. Concepts are encoded in most artworks, at least in all that make it to the museum and visiotors bother to see and acedmics to write about. I focus here on major examples. Psyche and […]