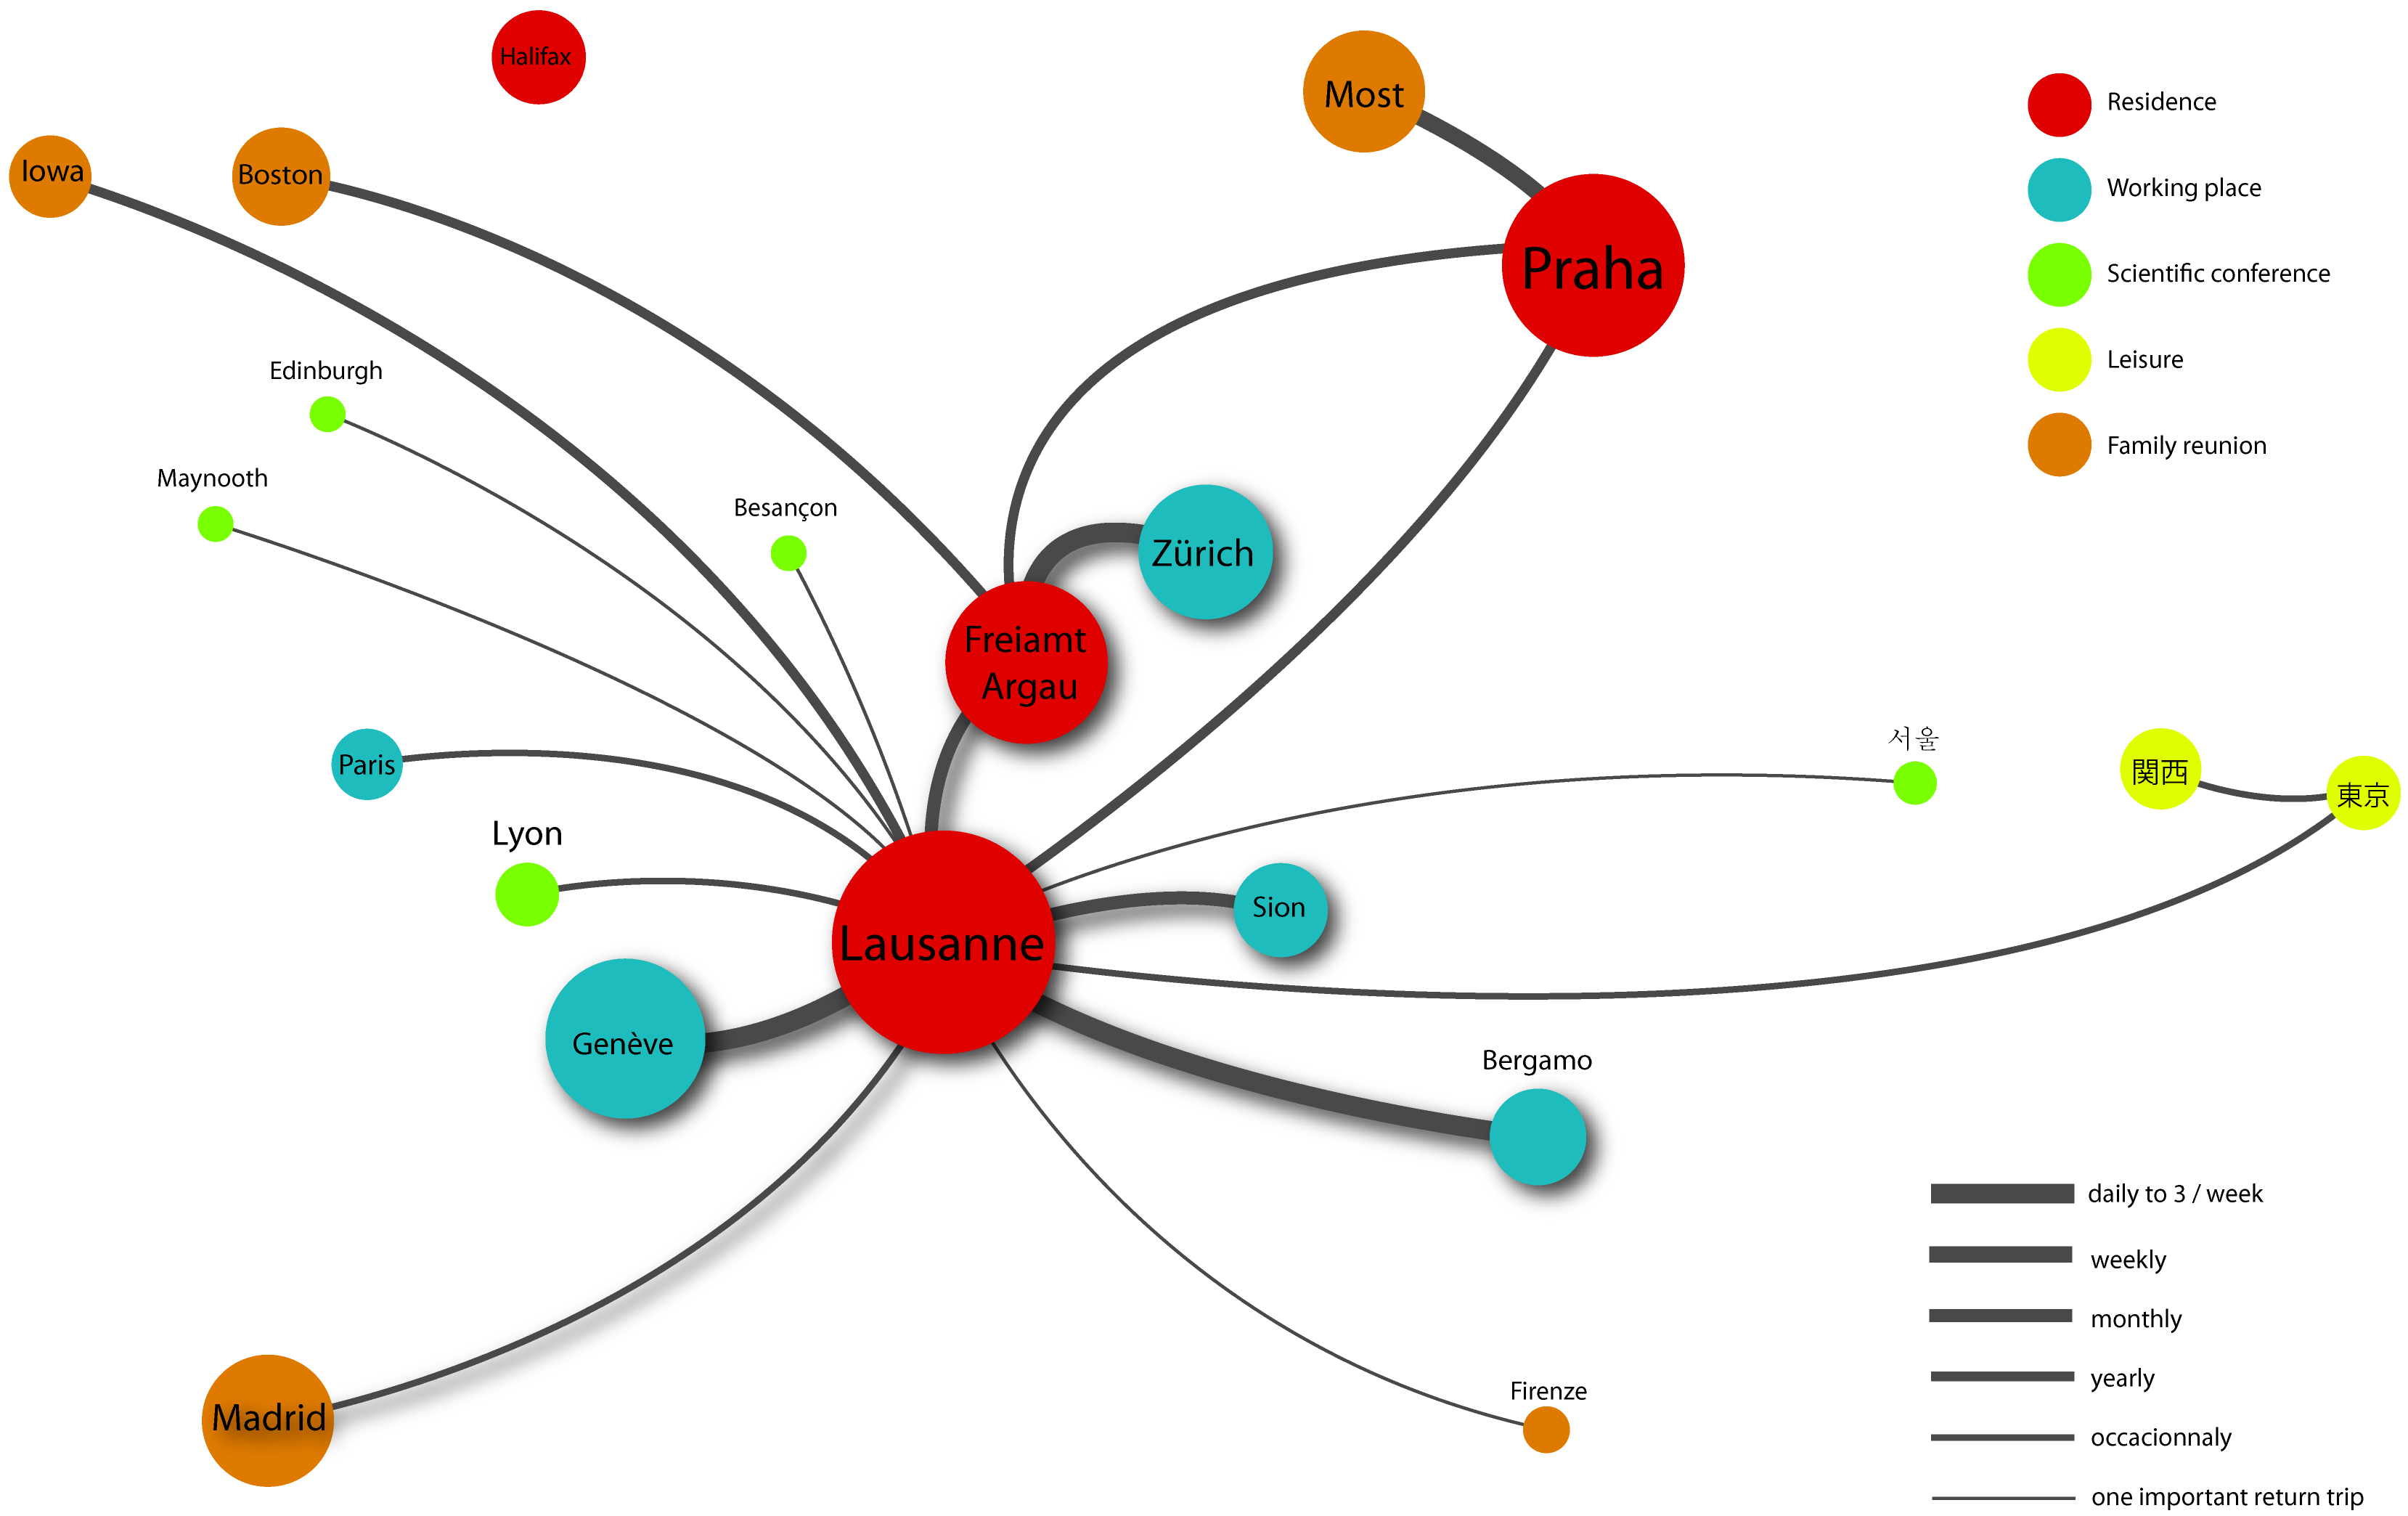
This is a map by which I’ve presented myself to my students on the first day in a course on tourism and mobility. I’ve given it in 2010 at the Università degli Studi di Bergamo. I wanted to make two points by showing it:
What a professor teaches is deeply rooted in who he is. You can only acquire […] Continue Reading…


