
The infographic above looks like a sunset or a sunrise rendered in an impressionist painting of the pixel age. It illustrates EU’s per capita domestic product from 1998 to 2011, expressed in “purchasing power standard” (PPS). To get the PPS, you divide the per capita GDP by the purchasing power parity index. It says, more […]
Author Archives: André Ourednik
Restore “New > Text file” in Windows’ contextual menu
If you’ve changed your standard .tex file editor to Notepad2 or Notepad++, chances are that the contextual menu entry “Create New > Document file” has disappeared. To restore it, just save the following code as a .reg file and run it (thanks to Archos alias Limneos for posting the code on a SevenForums): Windows Registry […]
I want Windows 7 to sort my files alphabetically, and I mean from 0 to z!
I want Windows 7 to sort my files alphabetically, and I mean alphanumerically, from 0 to z, in ASCII order. Windows 7 acts way too smart sorting files by names to my taste. On more ancient versions of Windows (e.g. Windows 2000) the sorting order would be something like this: Ie4_01 Ie4_128 Ie401sp2 Ie5 Ie501sp2 […]
The shadow of Curiosity
This morning August 6th, after fourteen years of planning and months of anxious waiting, the Curiosity mars rover has landed, sending as a proof of its success a fisheye picture of pebbles, dust, and its own shadow on the surface of Mars. It is the largest and most advanced machine to ever land on another […]
The Islands of Jean-Jacques Rousseau
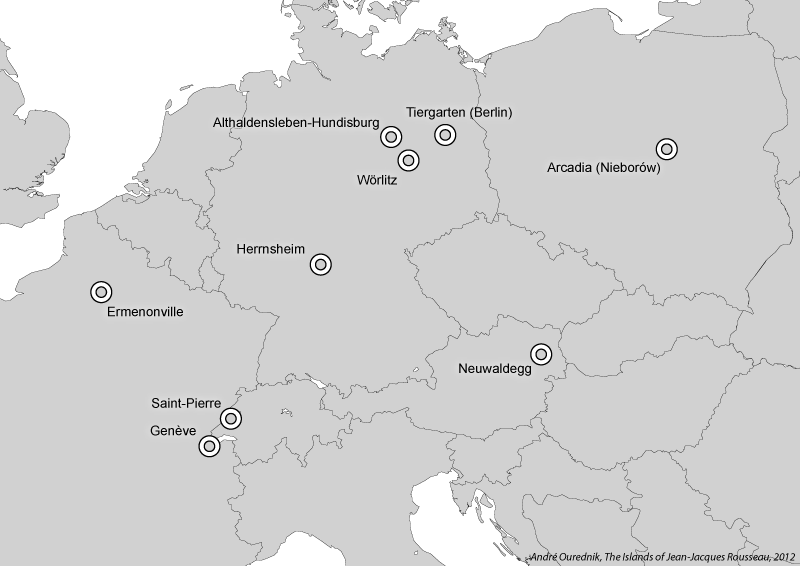
[Une version révisée, en français, de cet article, publiée dans Le Temps, Genève, en 2012, peut être téléchargée ici.] Jean-Jacques Rousseau would have been 300 years old today. He was already 53 in October 1765 when he left the waves of the Lake Bienne, heart-sick, expelled from the Island of St. Peter upon the order […]
Colored proportional circles in ArcMap
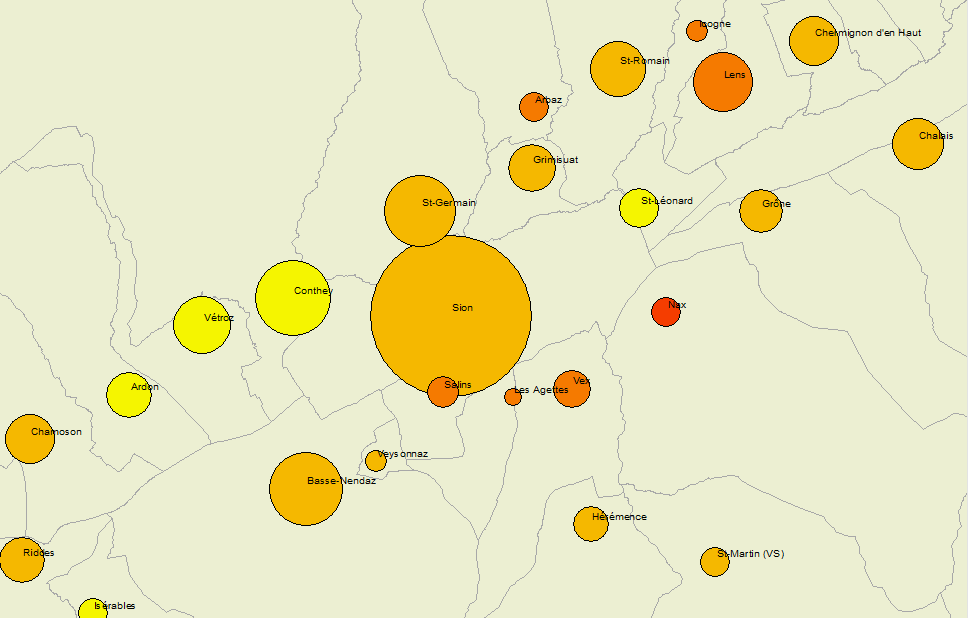
Bivariate thematic mapping with ArcMap? Yes you can! Of course, you could also do it in D3.js (including a nice self-generated legend), or with much less effort in Quantum GIS (post in French). Whatever method you choose, colored proportional circles cannot be drawn directly on polygons, but you can draw them on points. Thus, all […]
A mobility network
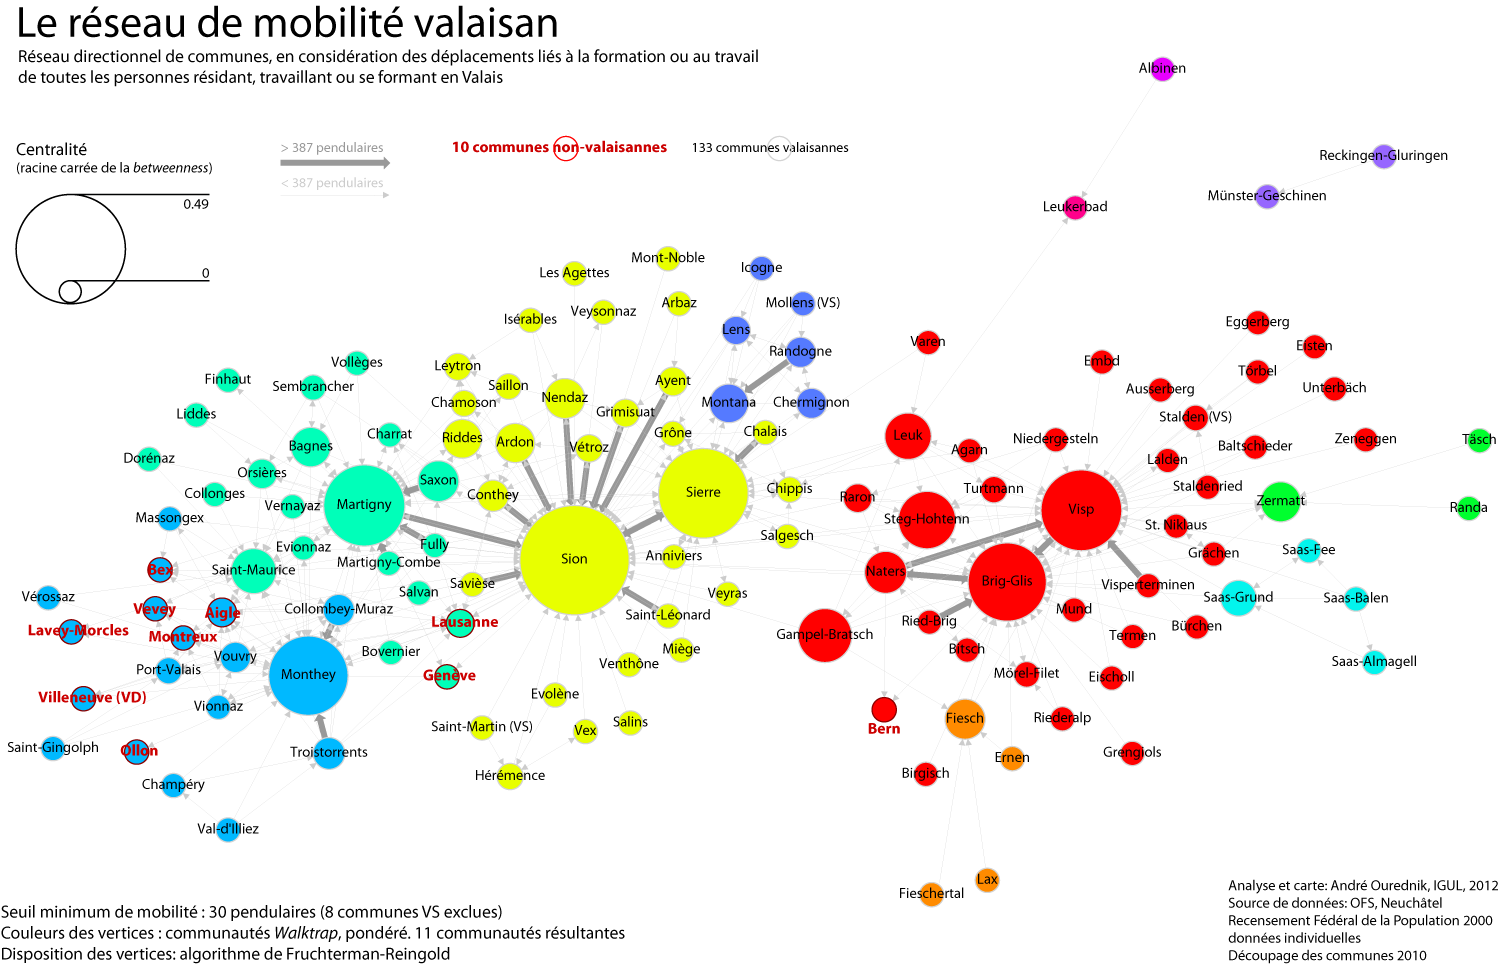
Methods and tools After a day and a half of work and fine-tuning, here we go: the commuting network of all individuals either residing, working or studying in the canton Valais. I’ve used R, with the RStudio GUI, and the igraph library for R. My staring point was the mobility matrix between all communes, including […]
Crop an image in Adobe Illustrator CS3 or later
When you export maps from ESRI ArcMap to Adobe Illustrator, the raster background is by default exported as a series of associated bitmap strips, with superposed vector polygons.Here an example: In this – as in many other situations – you might need to crop the image to a specific area. Say the following rectangle: To […]
Fifty years of orbital tourism

Today, the United States are celebrating the 50th anniversary of John Glenn’s orbital flight: three tours of the globe in less than five hours. To mark the occasion, Craig Russell of Space Operations Inc., would have liked to see the mission replayed, but relying on private means only, this time. We get his point, because […]
Foucault’s left-overs and the urban heterostasis

Michel Foucault, in his 1984 essay Des espaces autres (Other Spaces), coins the term “hétérotopie”. He uses it to designate places evolving on the margin of what we could today call the territory of production. Foucault’s heterotopoi are cemeteries, brothels, prisons, boats, psychiatric hospitals… places inhabited by those who’ve either been excluded from society, or […]