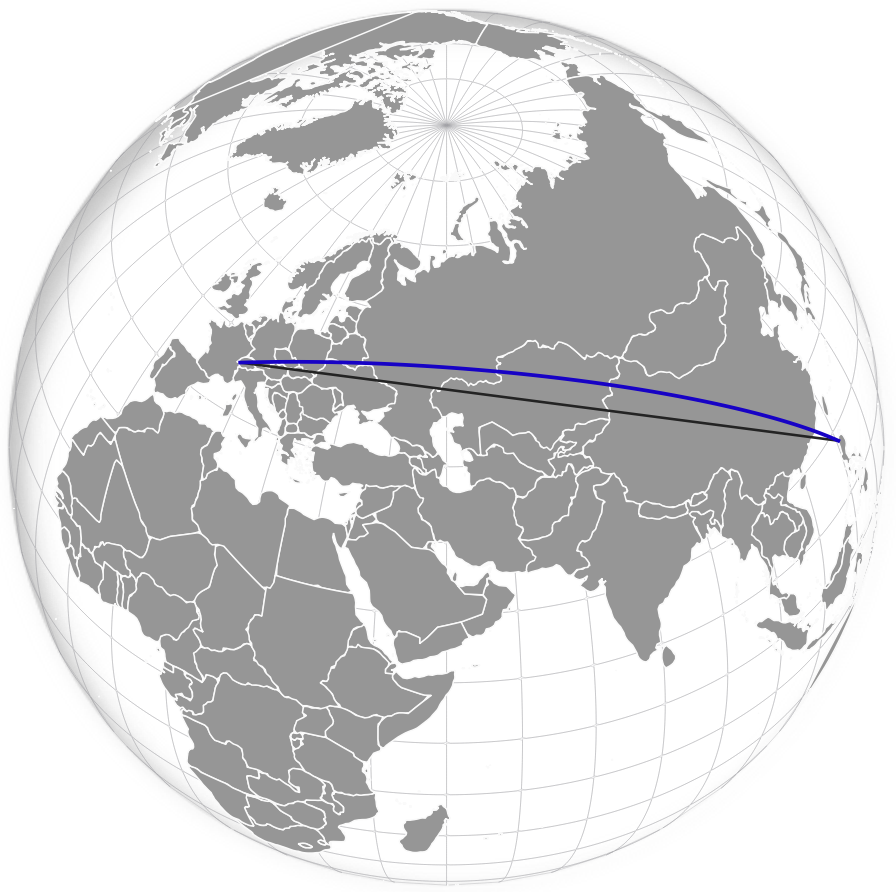
Le chemin le plus court connectant deux points sur n’importe quelle surface s’appelle une géodésique. Sur un globe, la géodésique est forcément courbe. En cartographie, c’est la seule forme géométrique qui représente correctement les distances “à vol d’oiseau”, surtout si votre échelle d’observation est celle d’un continent entier. Autrement dit: ne dessinez jamais une ligne […]
Author Archives: André Ourednik
Le cinéma et l’IA comme médiation de la nature
La nature est ce qui dépasse toutes les structures et les projets. Elle s’étend au-delà des remparts de la ville; au-delà des barrières qui nous séparent de l’inconscient. La nature est ce qui ne peut être déterminé, car elle naît d’elle-même et se détermine elle-même. La nature est la zone du dehors. Tourner un documentaire […]
Intégrer des fonds de carte d’un service web dans QGIS
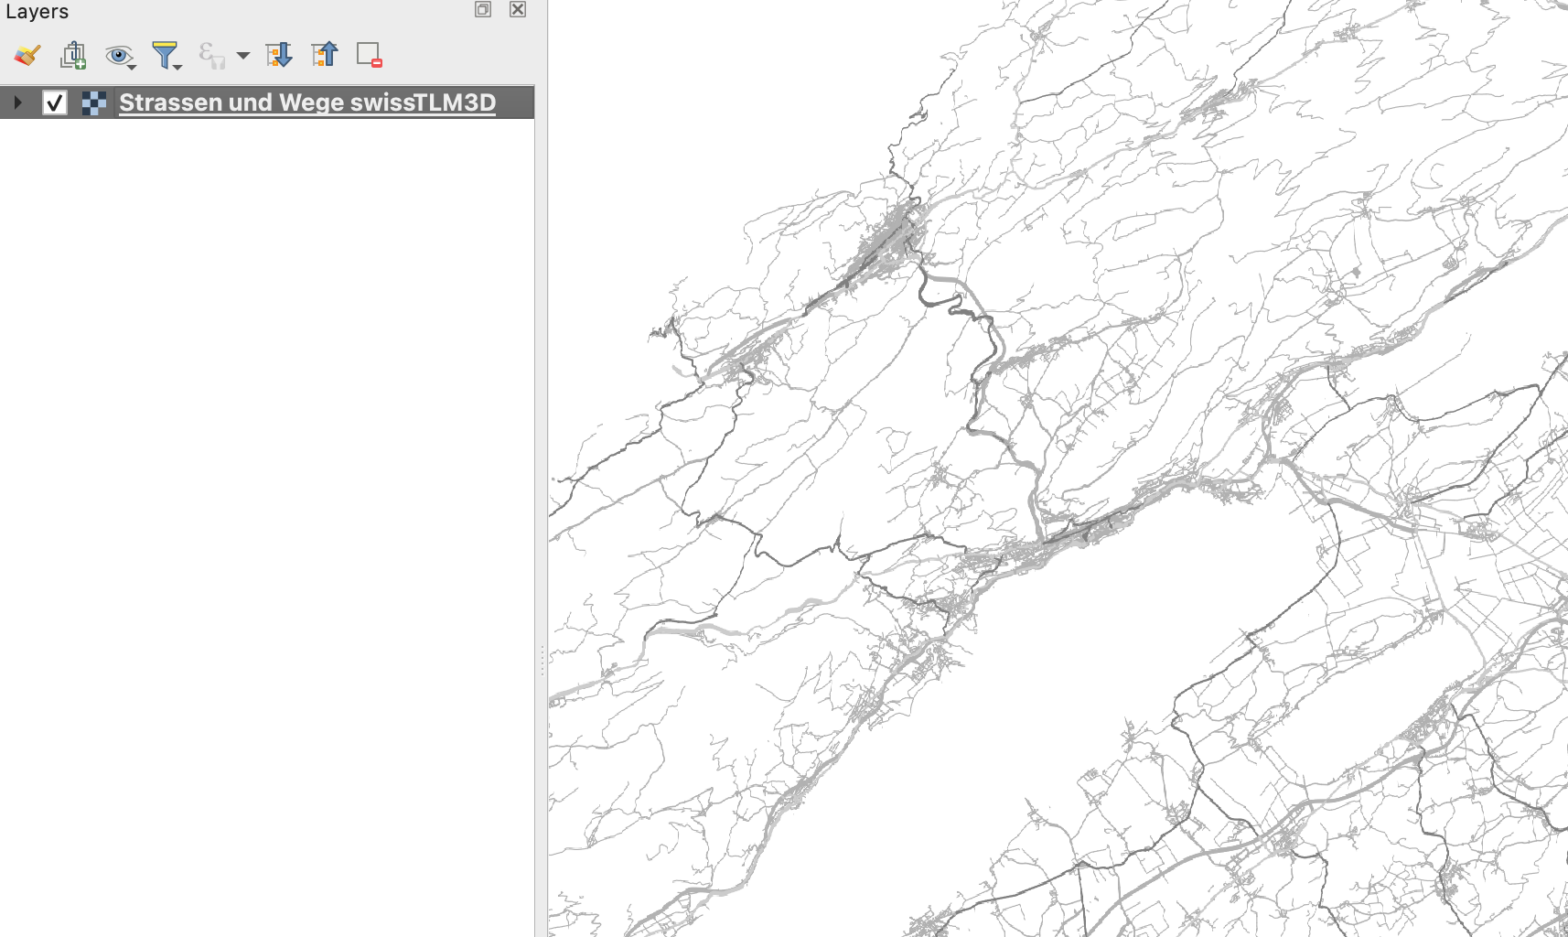
Pour certaines cartes, il convient d’utiliser un fond de carte de données vectorielles stockées sur votre ordinateur. D’autres sont disponibles par un service en ligne. Les serveurs WMS Un WMS (Web Map Service) est un protocole de communication standardisé qui permet de diffuser des cartes géographiques sous forme d’images à travers Internet. Plutôt que de […]
Régression de l’occupation des sols (LUR) avec R
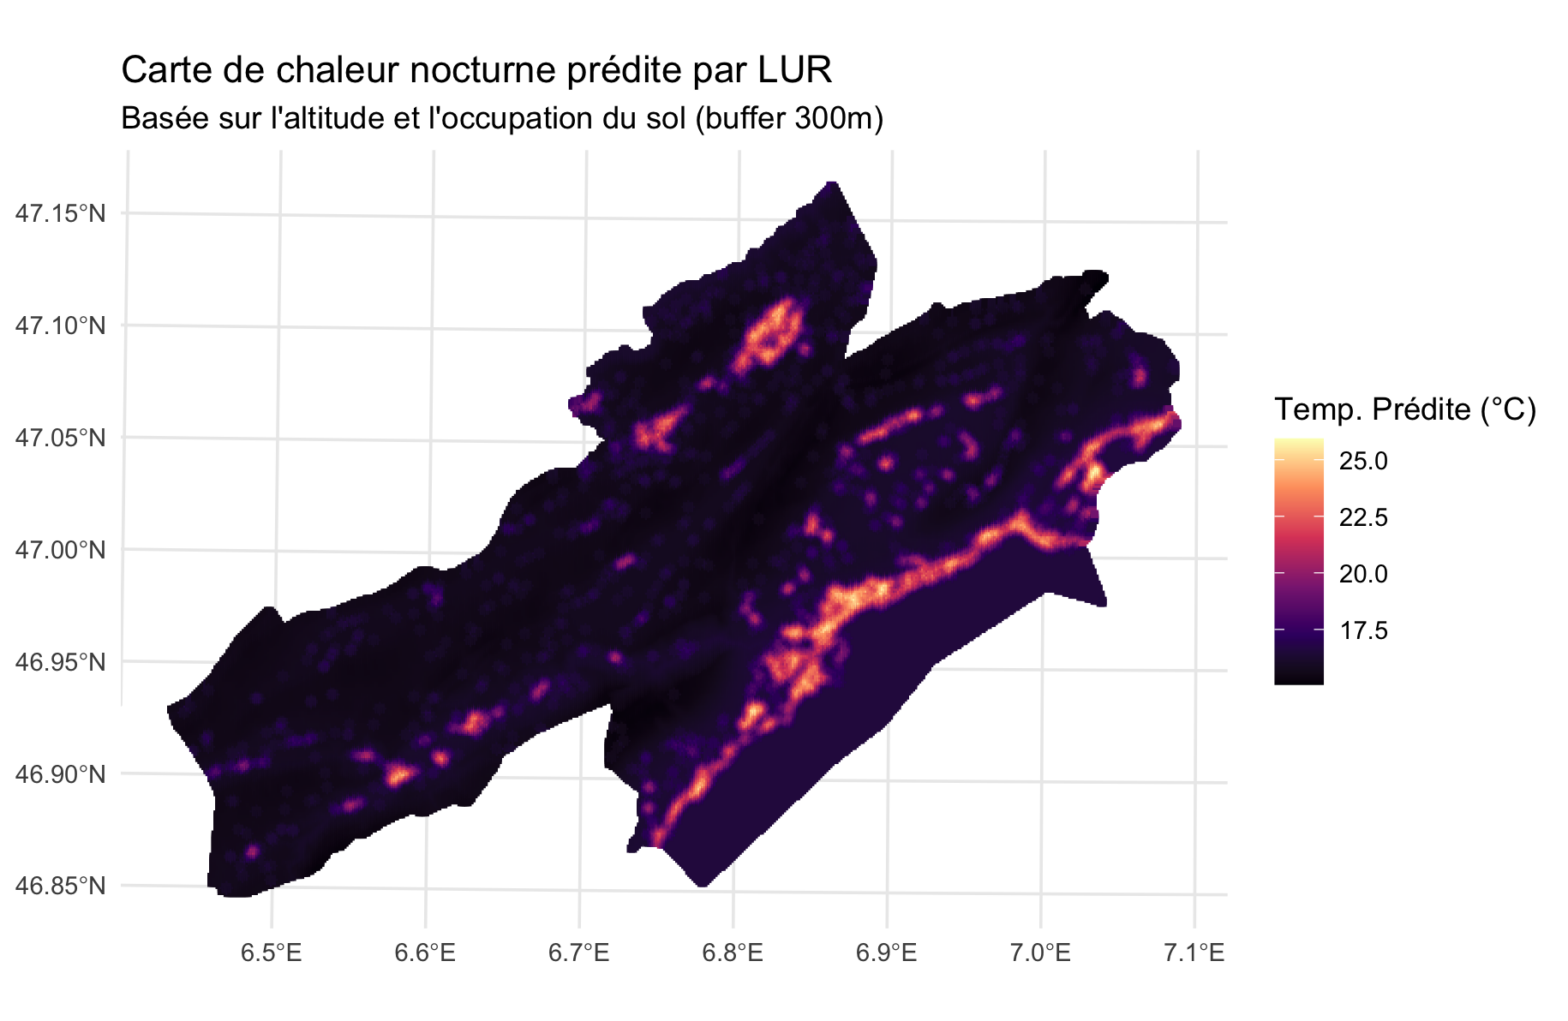
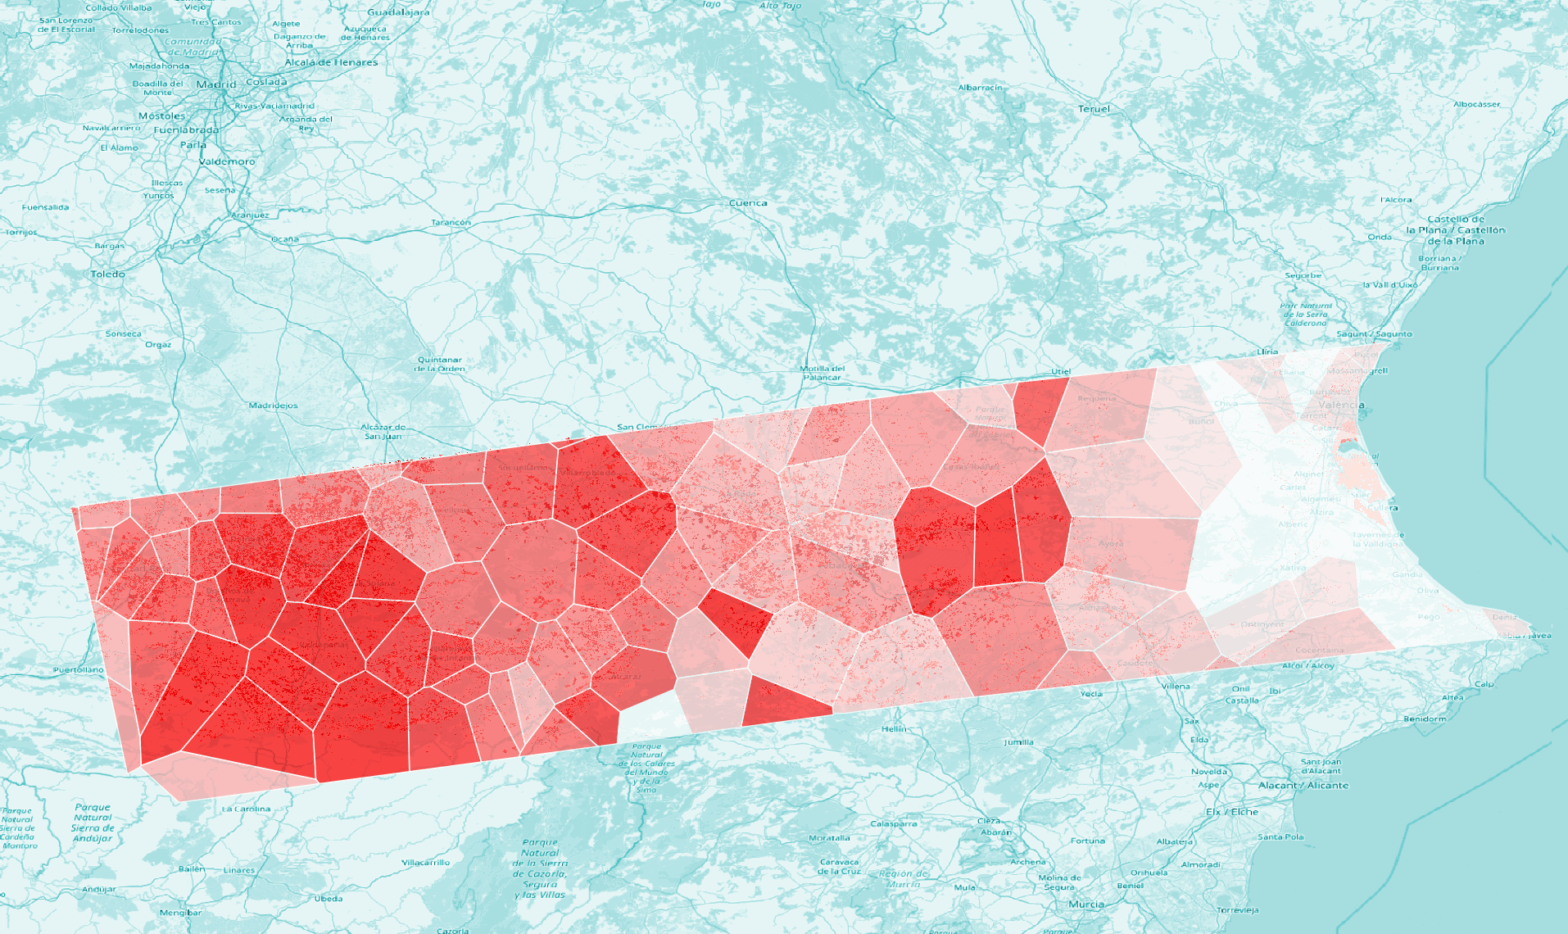
La modélisation par régression de l’occupation des sols (Land Use Regression, LUR) cherche à prédire les valeurs locales d’une variable à partir de caractéristiques environnementales mesurées dans des zones tampons (buffers) autour du lieu de prédiction. La LUR permet de créer des cartes de chaleur (heatmaps) à haute résolution des valeurs de la variable prédite. […]
Cartes et continuités
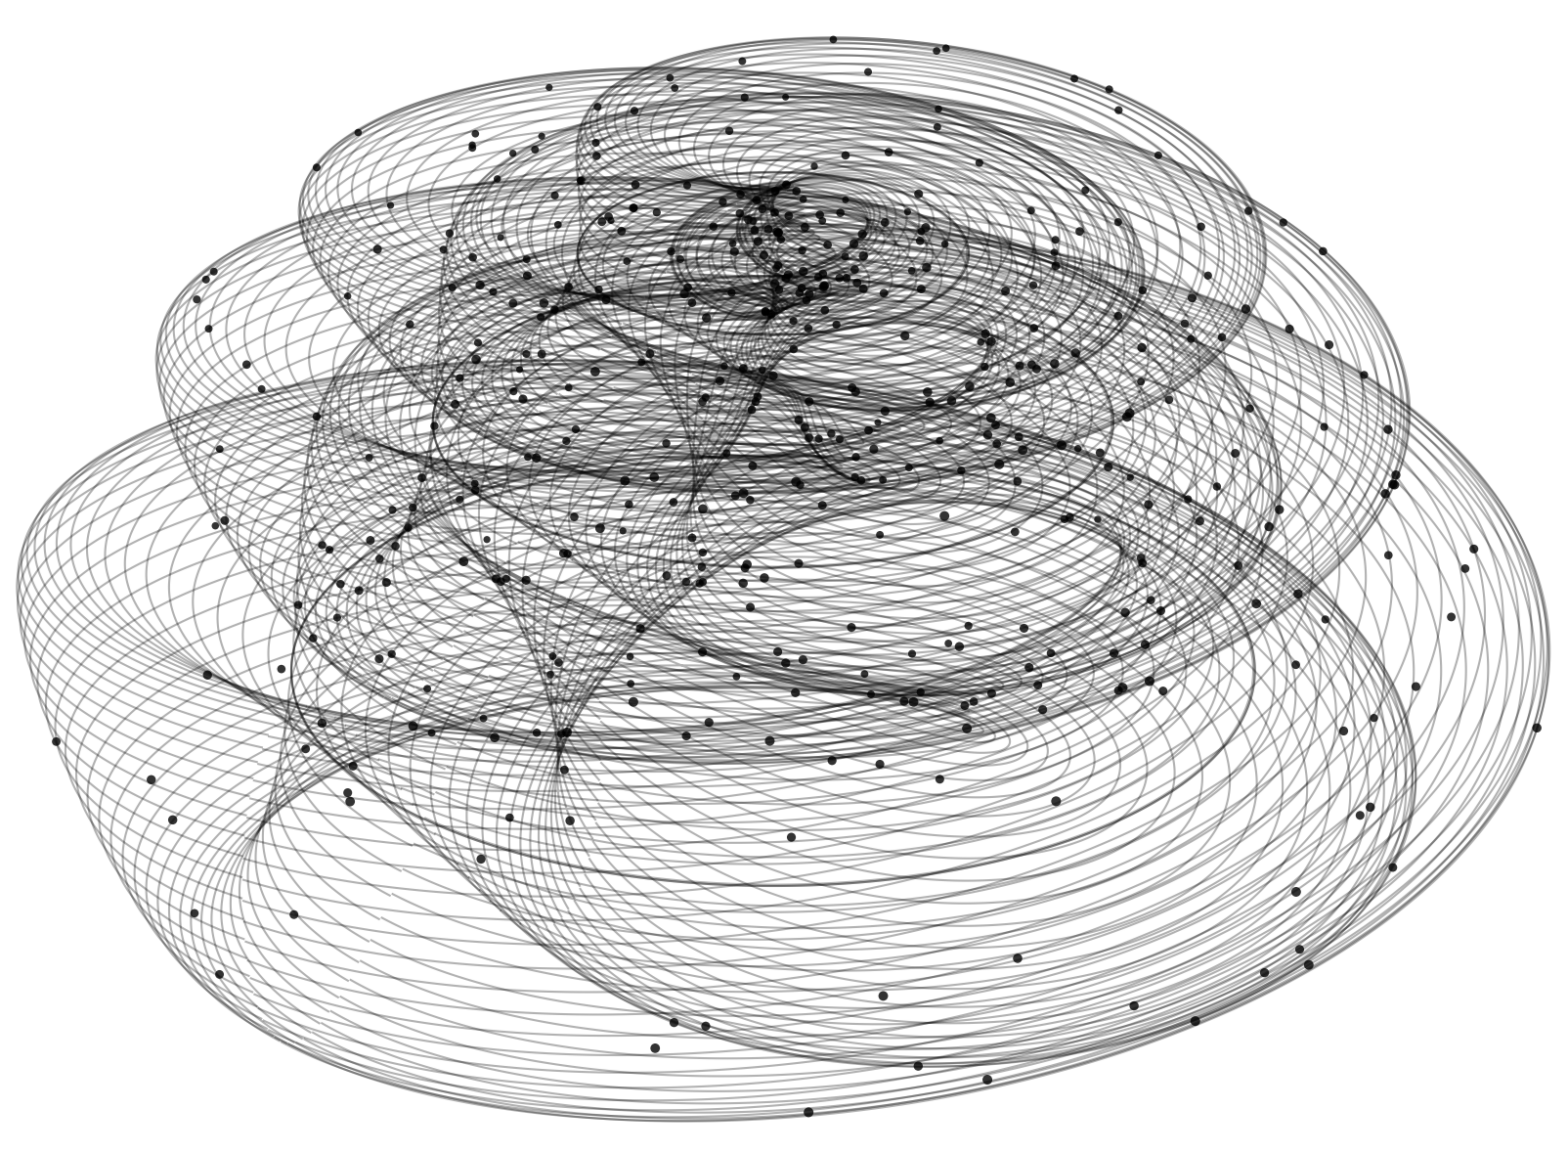
J’aime, dans les cartes, l’illusion de continuité qu’elles procurent. Cette idée de distance à vol d’oiseau qui nous fait oublier que nous sommes des animaux sans ailes ; lestés au sol, voués à tracer nos vies en suivant les aspérités du terrain. Les courbes de niveau ne laissent deviner qu’une infime partie des obstacles. La […]
L’agence fédérale ICE détournée comme outil de répression domestique? – un regard cartographique
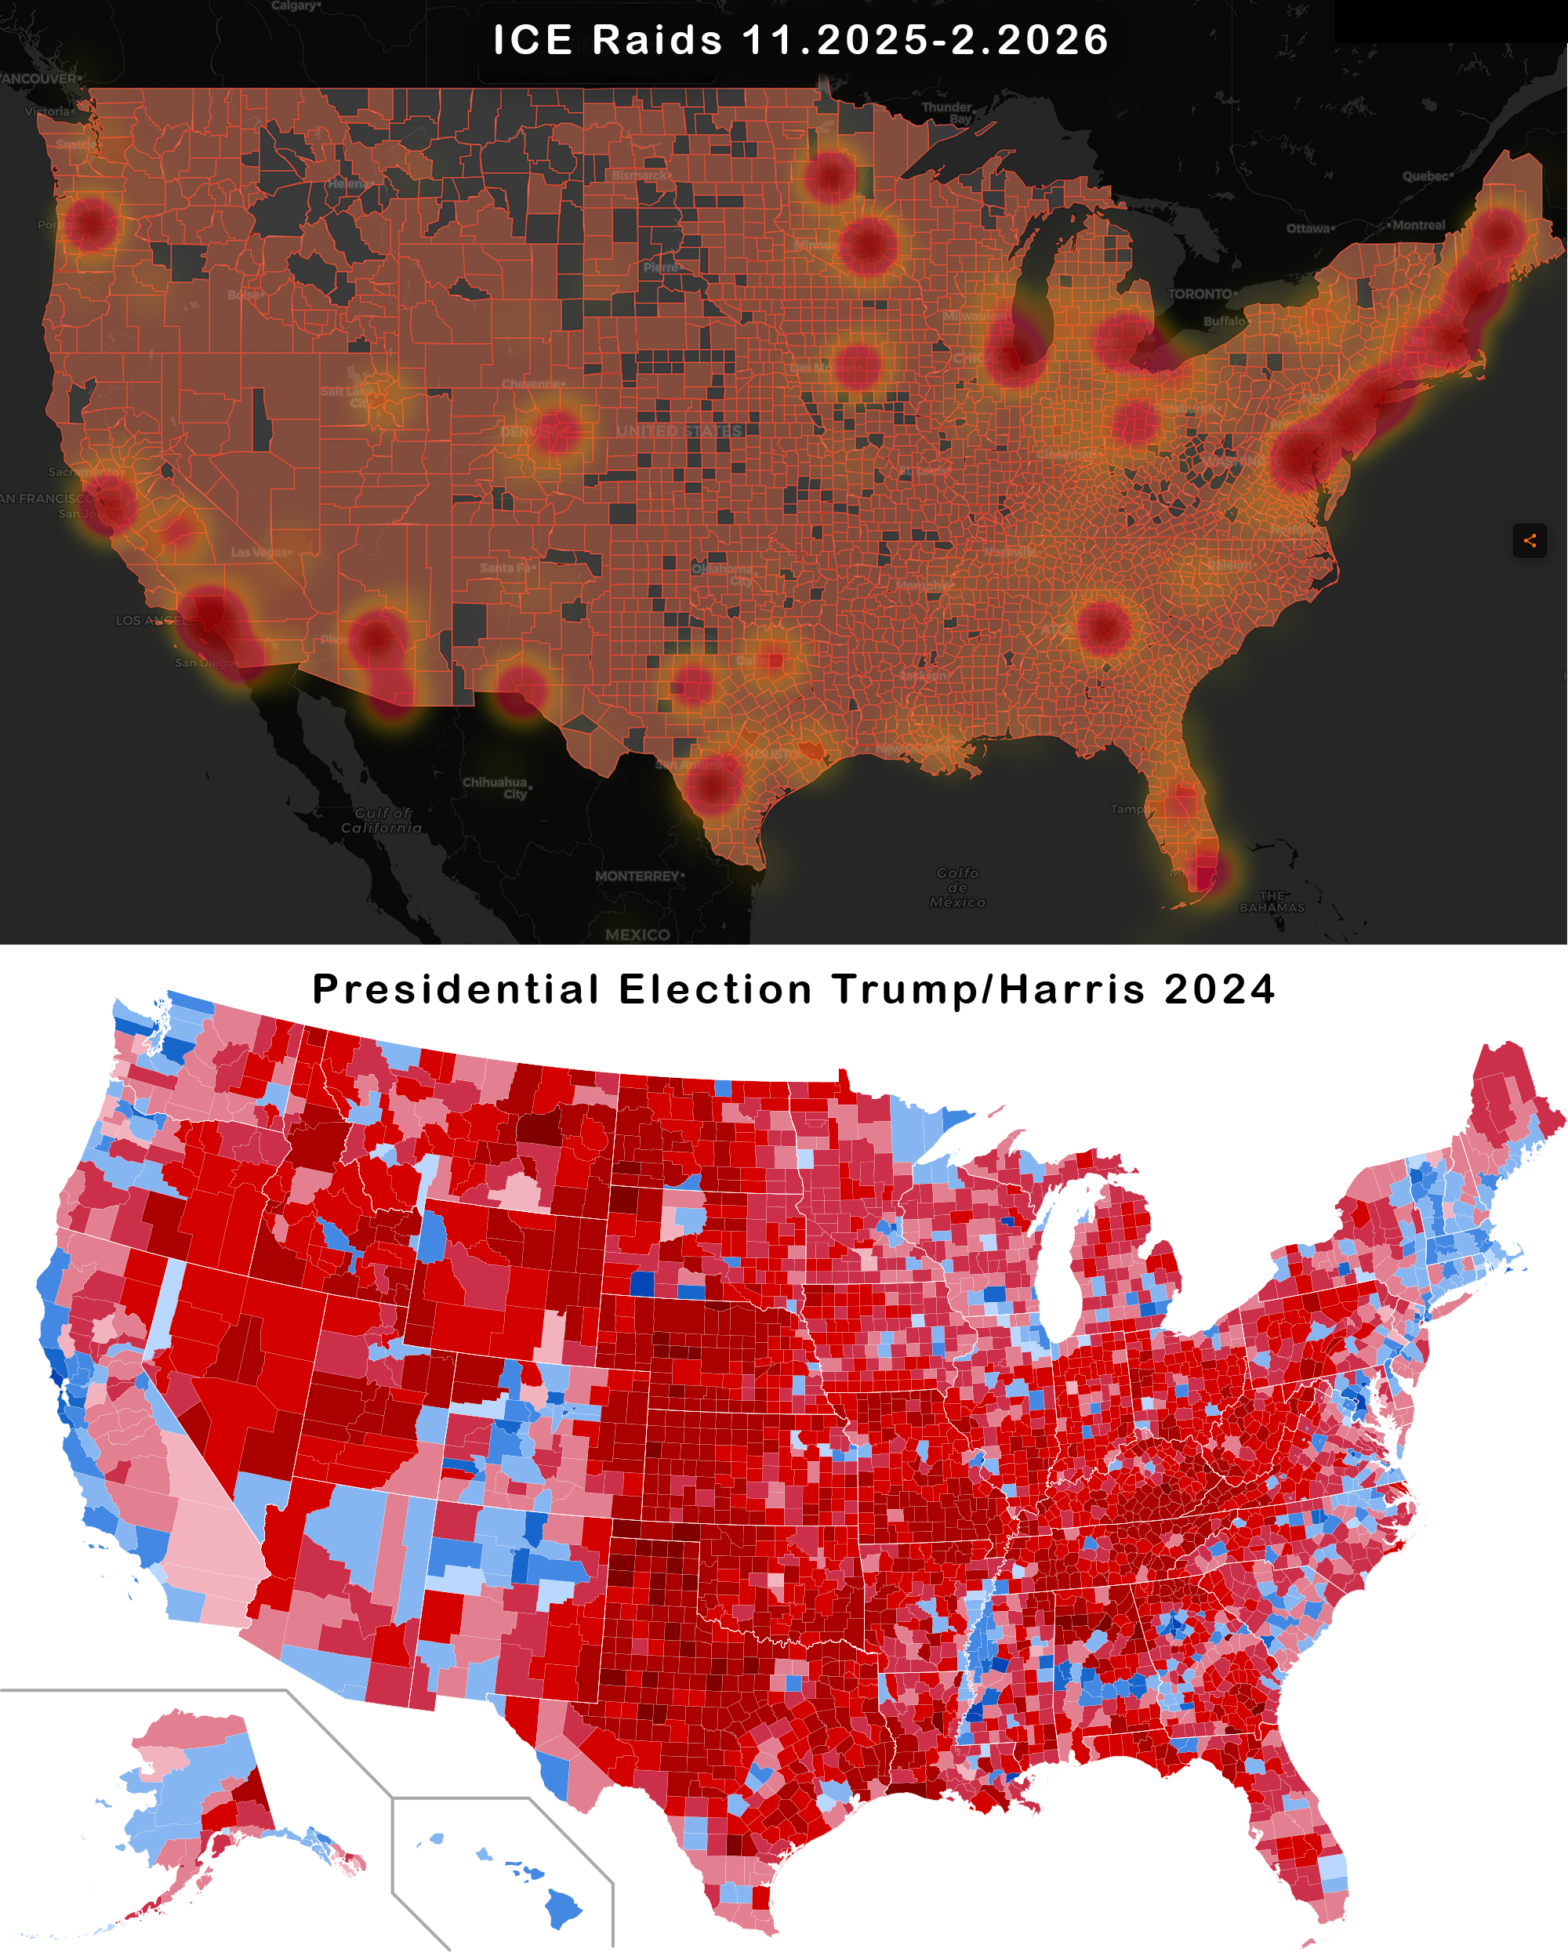
L’agence fédérale ICE, aux USA, mène actuellement une campagne de déportation voulue massive. Ses effets concrets suggèrent toutefois que son but serait aussi, voire surtout, d’intimider les opposant·e·s politiques du président Trump. Une comparaison des cartes électorales avec celle des activités ICE corrobore cette hypothèse. Notons en préambule que la carte est compilée à partir […]
OuroborosTree : Visual Data Exploration for Biosphere-Conscious Nutrion
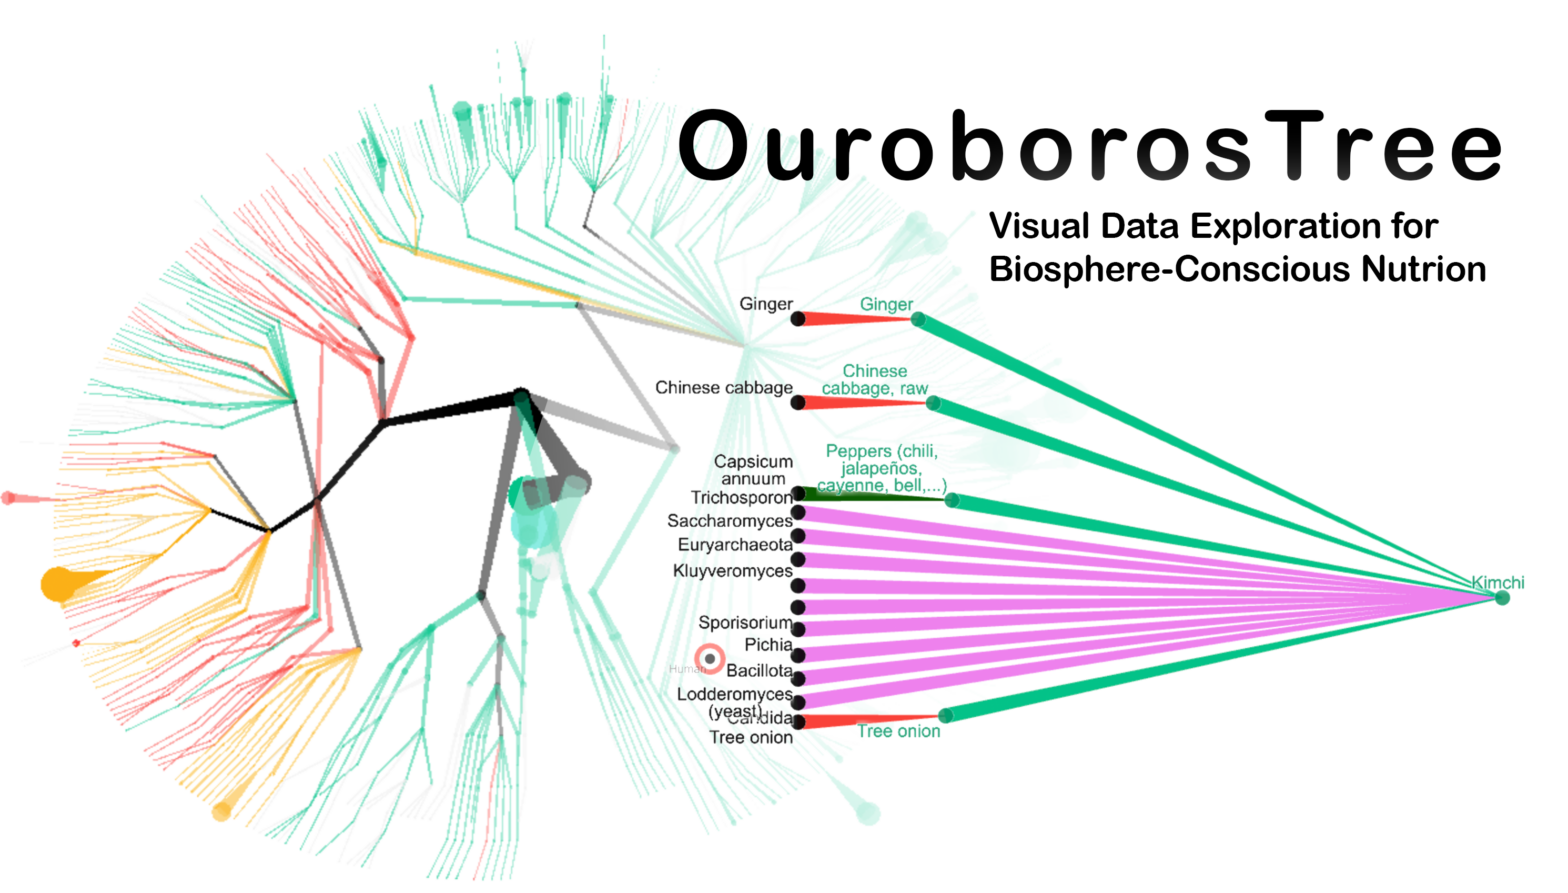
OUROBOROS TREE is a visual application for exploring relations between human nutrition and living organisms. I have built it because many contemporary issues can be addressed through a prism of our relationship with “non-humans” (according to Bruno Latour’s terminology). The project is evolving and welcomes feedback from the public. OurobosTree harmonizes, for the first time, […]
Statistiques zonales et autres agrégations de géodonnées (Qgis, GDAL, R)
L’objectif de cet exercice est d’apprendre les rudiments de l’agrégation de données en géomatique. Nous agrégerons des données vectorielles ponctuelles dans des zones (polygones), puis nous apprendrons à générer une statistique zonale à partir de données raster. Nous verrons aussi comment préparer les données raster pour rendre une statistique zonale possible. Données de test et […]
The exponential line of technological progress… really?
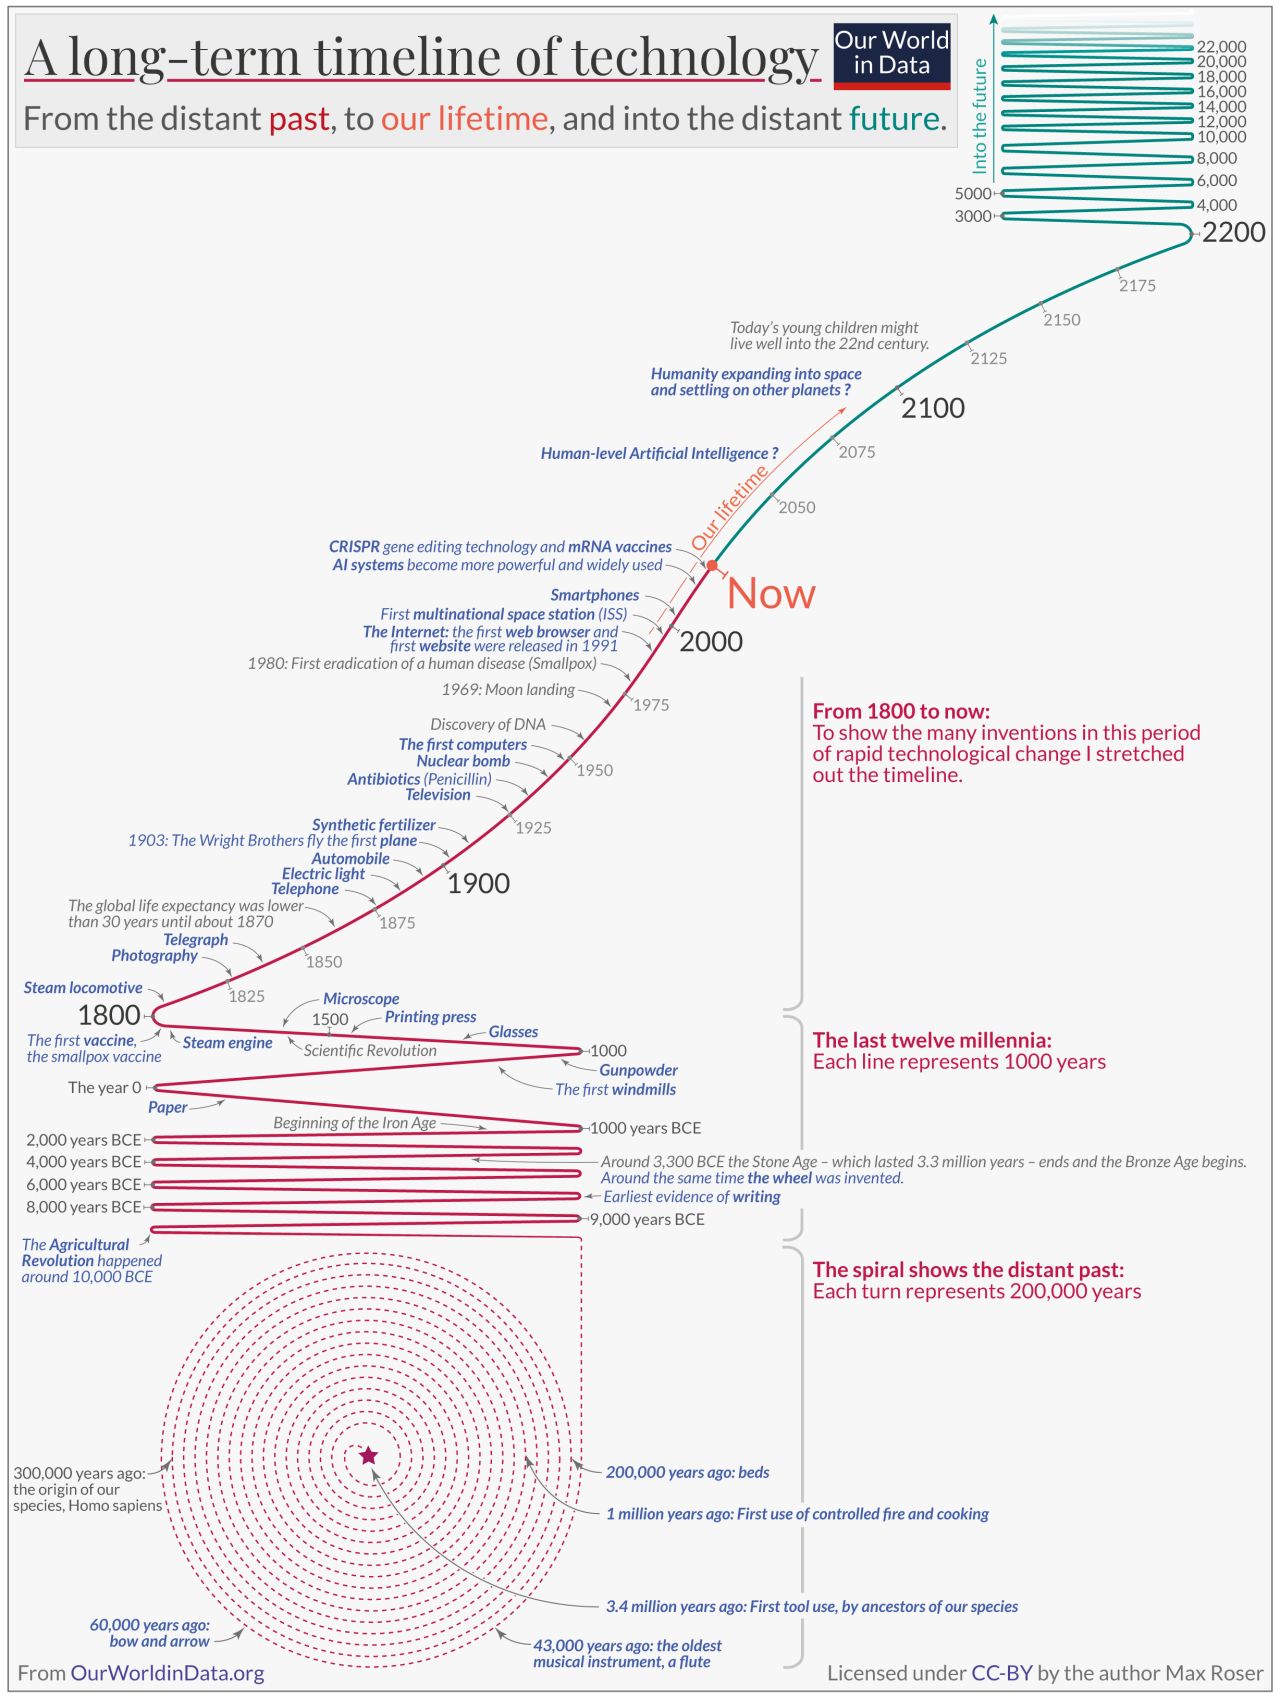
A couple of days ago, I stumbled on LinkedIn on this image showing a long-term timeline of technological development by Max Roser, founder of Our World in Data. The graphic is impressively synthetic, and deals beautifully with exponential time scales, both prior and after the modern epoch. But I am not convinced that the evolution […]
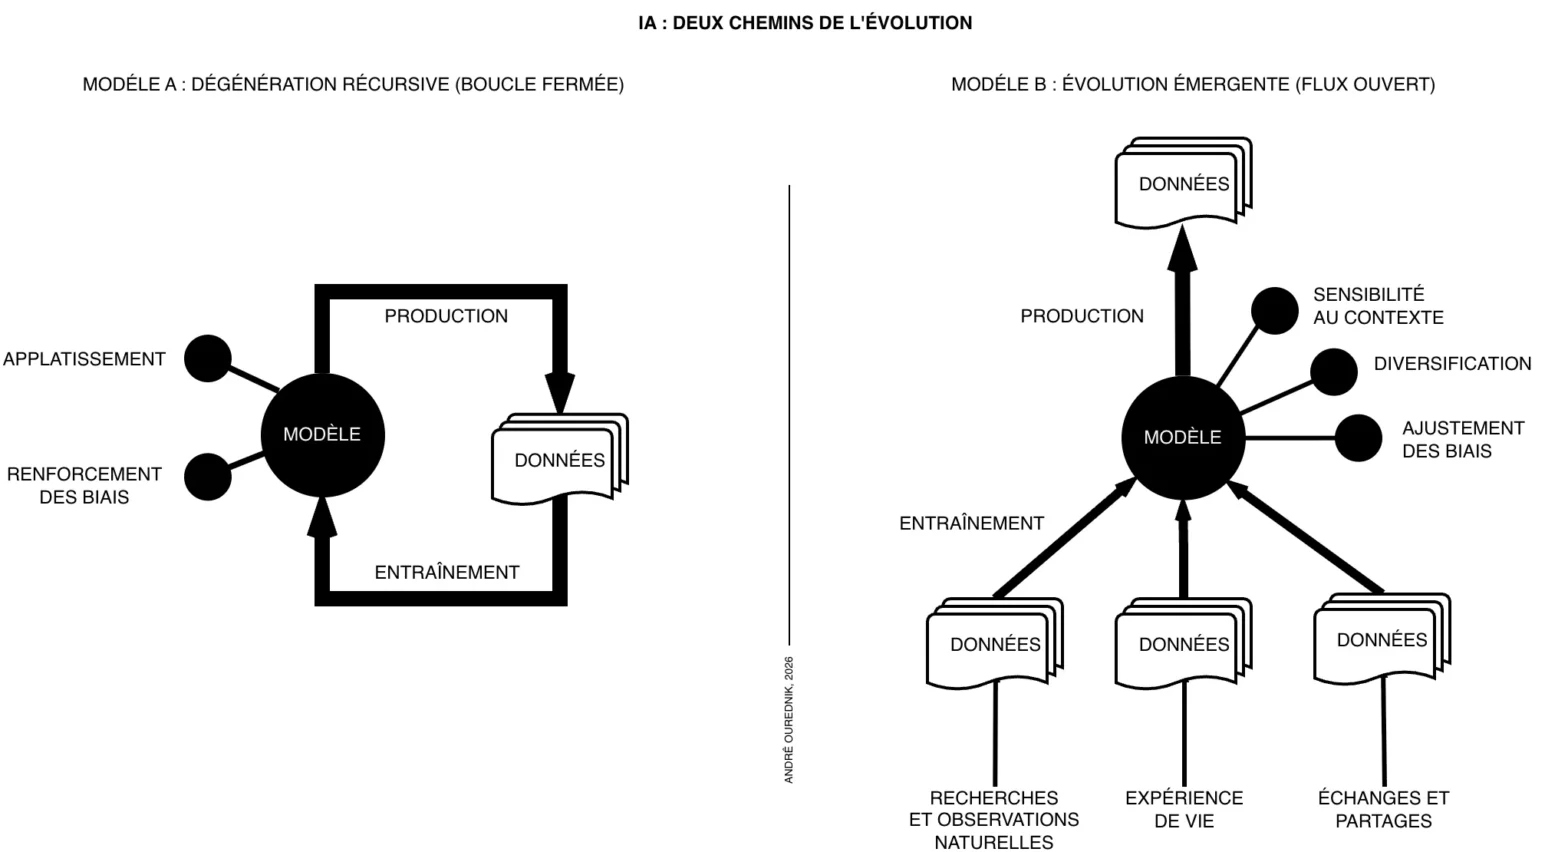
Domaine de l’IA et domaine humain: pensée totalisante et pensée itinérante
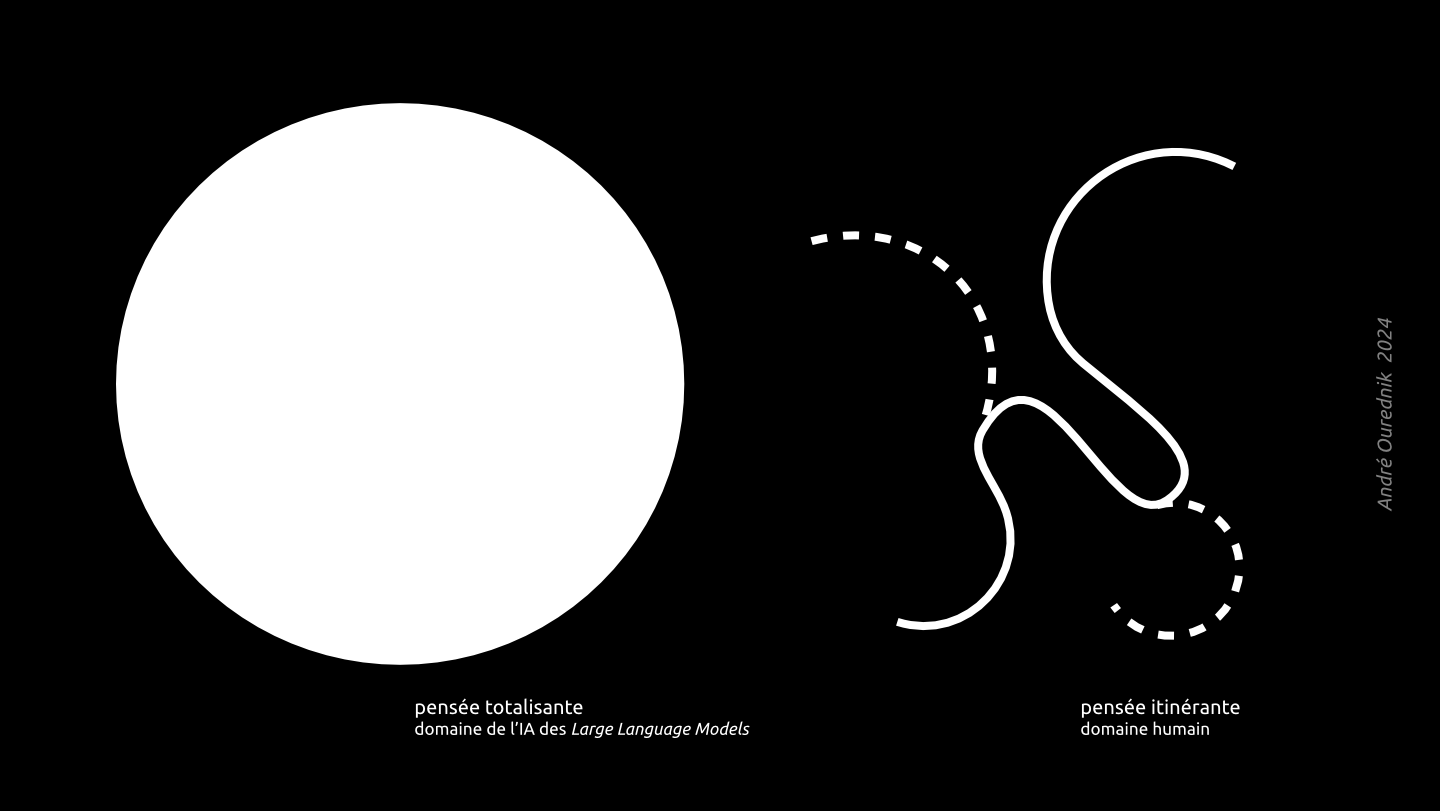
Notre Journée pédagogique, organisée par le programme SHS de l’EPFL, a donné lieu à de riches débats au sujet des enjeux de l’IA dans l’enseignement. Si les sciences de la nature, de l’architecte et de l’ingénieur·e posent déjà d’excellentes questions déontologiques et écologiques dans ce domaine, l’apport des sciences humaines et sociales est multiple et […]