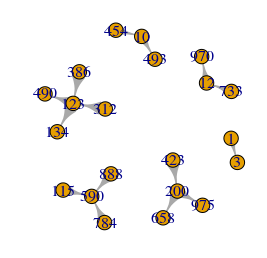
Many user of igraph for R expect the functions ego() and make_ego_graph() , that take a list of vertices as input, to generate a new graph composed of the neighbors of these vertices. Unfortunately, these functions do no such thing. They generate a list of igraph.vs objects, which cannot be further treated as an igraph […]
Tag Archives: rstats
Unknown column? Force encoding of an entire table from “unknown” to “UTF-8” in R on Windows
A common knitr issue on Windows Running R scripts on a Windows machine is equivalent to a dive into enconding hell. In effect, your non-English data most likely contains characters like Ä, ü, è or š, or even 语言. In all cases, the only serious way of dealing with these, in fact with any data […]
Cleaning up PDFs of pre-1990s scanned texts for text mining in R with Quanteda
Text sources are often PDF’s. If optical character recognition (OCR) has been applied, the pdftools R package allows you to extract text from all PDFs to text files stored in a folder. The readtext package converts the set of text files into something useful for Quanteda. Nevertheless, some cleaning is necessary before transforming your text […]
Stacked histogram with bivariate colored bars in R
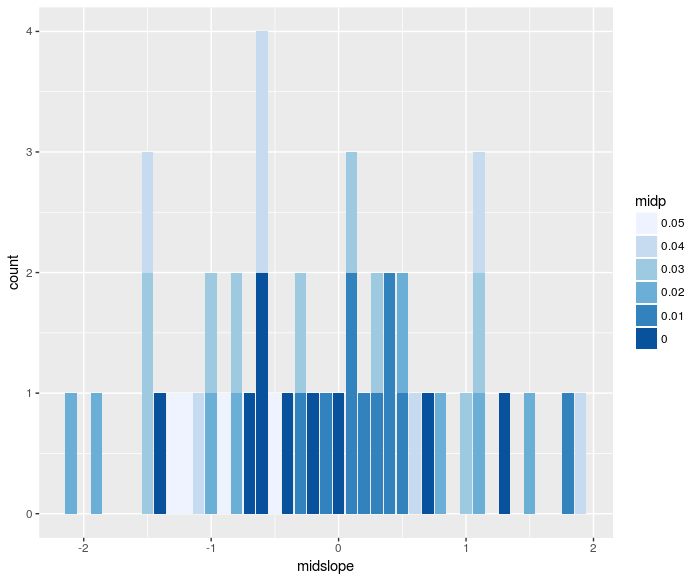
A histogram gives you counts of elements within spefic ranges of a variable, represented as bars. Sometimes, you want to see more than bars. The following code allows you to represent a second variable with a color shade:
Cartographie avec R
Les instructions de ce document sont encore valables, mais l’univers des modules R a beaucoup évolué depuis 2016. Aujourd’hui, les principaux développements en matière de données vectorielles se sont détachés des 3 anciens modules documentés ci-dessous (sp, rgdal, rgeos) pour se reposer principalement sur le modules sf. Pour une version mise à jour de cet […]
Visualiser des données avec R: barchart, boxplot, bubblechart 3D, histogramme, parallel coordinates, radar chart, stripchart
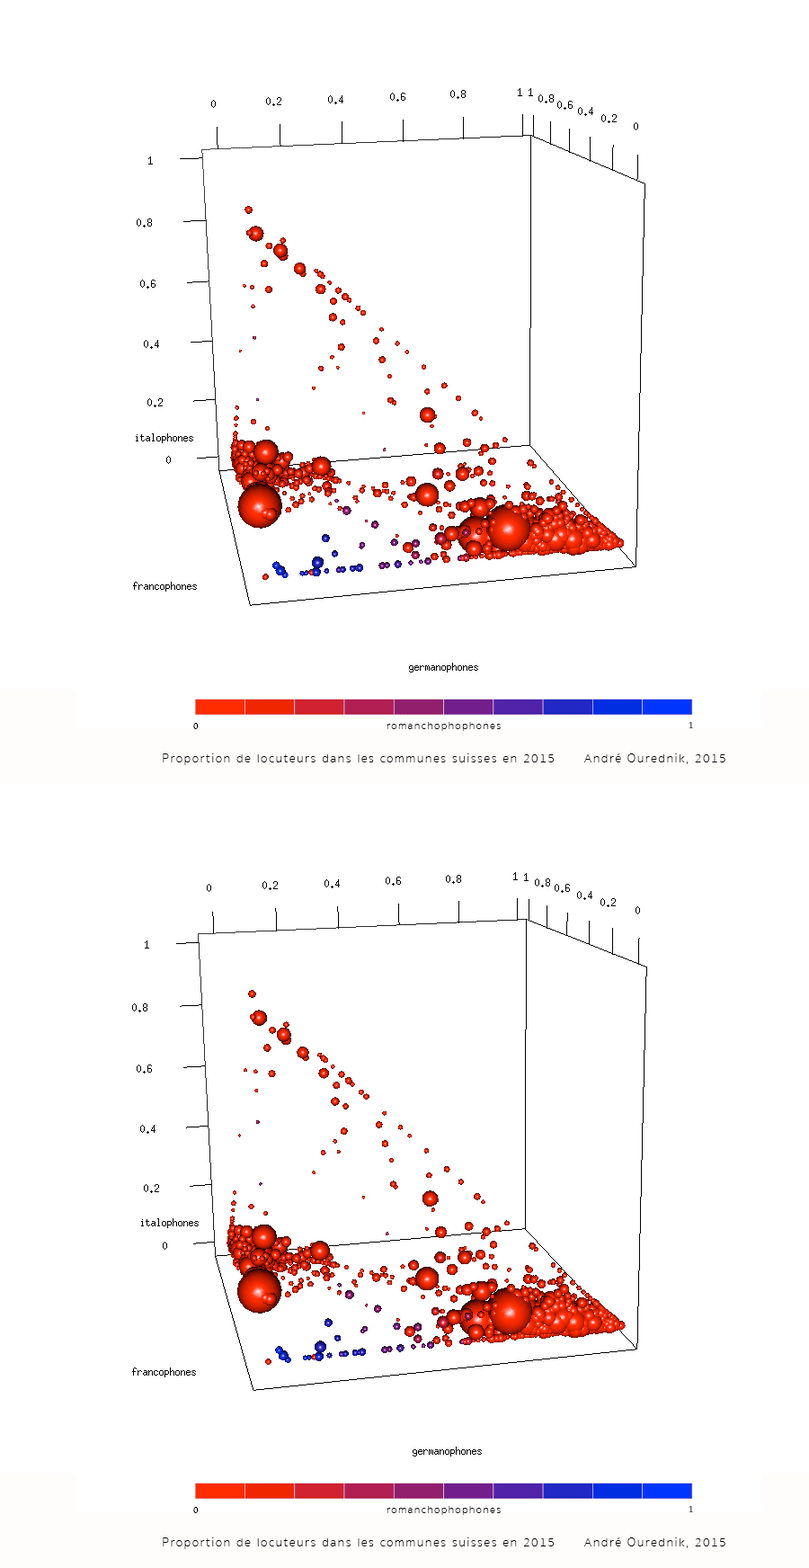
Cet exercice vous conduit à travers le processus de visualisation de données dans R. Il présuppose que vous connaissez déjà les bases de maniement de R et de RStudio. Charger les données Téléchargement Téléchargez le fichier unine_exercice1.zip depuis le site du cours. Décompressez le contenu de l’archive zip dans un dossier de votre choix, par […]
A mobility network
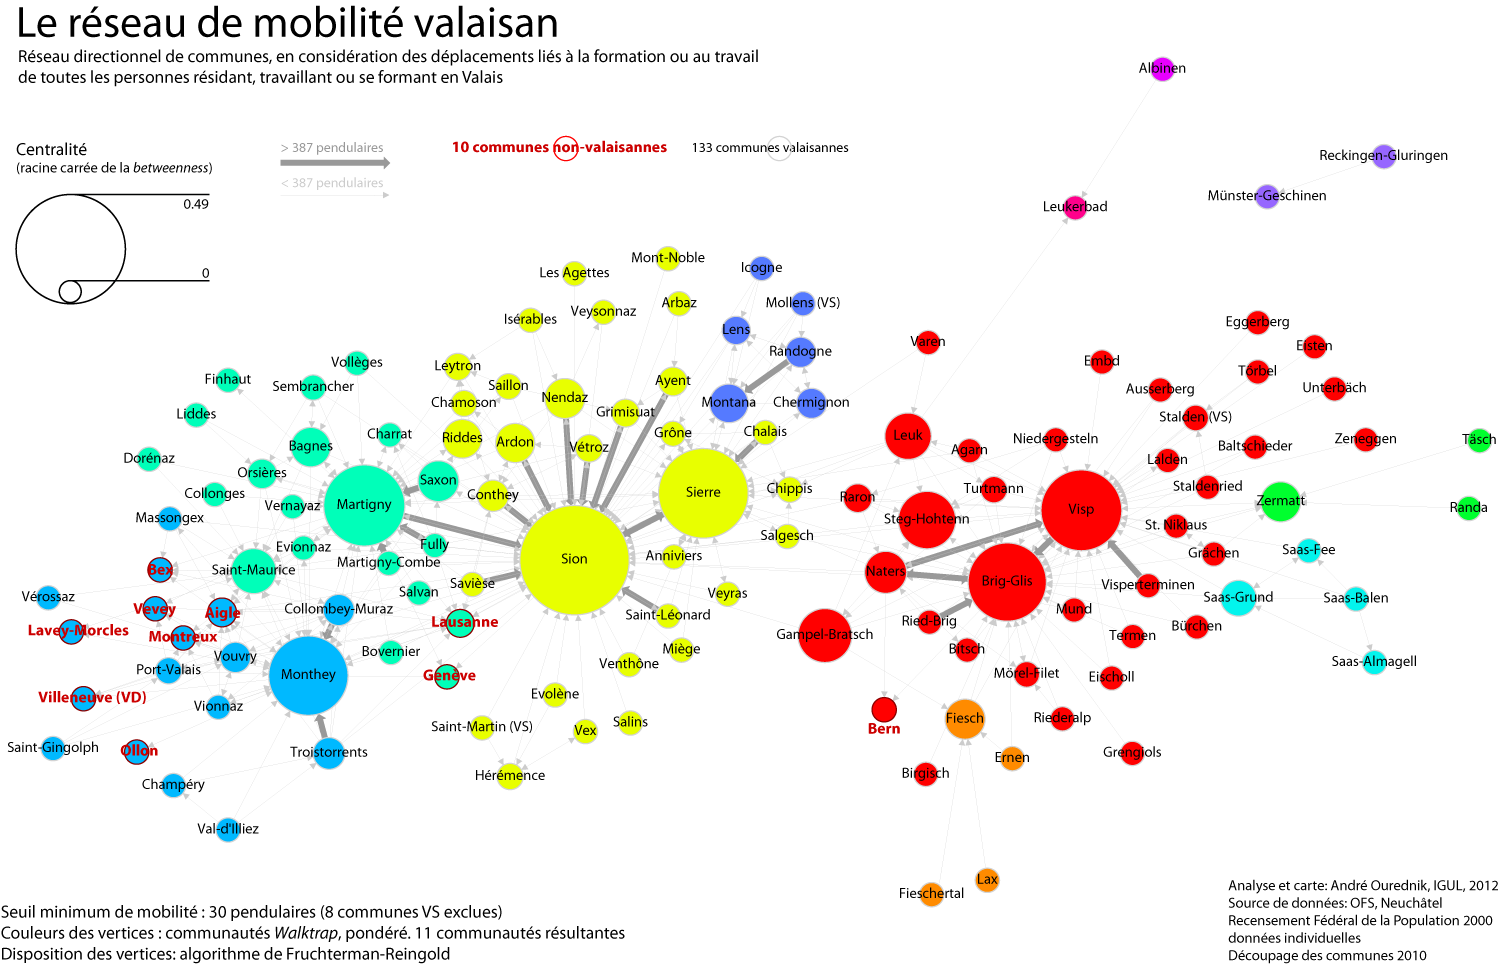
Methods and tools After a day and a half of work and fine-tuning, here we go: the commuting network of all individuals either residing, working or studying in the canton Valais. I’ve used R, with the RStudio GUI, and the igraph library for R. My staring point was the mobility matrix between all communes, including […]
RStudio – one big step towards user-friendliness of R
R is the greatest open source statiscal programming package around. It is all a mapper need to pretreat data. Yet it suffers from interfaces that are either uggly, tedious to set up, clumsy to use or all of these. After years of glaring at the Windows interface of R, I’ve finally sutmbled upon a nice […]


