
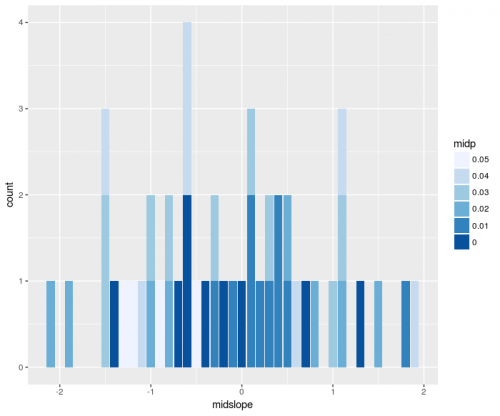
A histogram gives you counts of elements within spefic ranges of a variable, represented as bars. Sometimes, you want to see more than bars. The following code allows you to represent a second variable with a color shade:
library(ggplot2)
library(data.table)

# create an example of a table
d <- data.table(
 slope = round(rnorm(50),50),
 p = sample(1:50,50)/1000
)

# discretize continuous values
d$midp <- floor(d$p*100)/100
d$midslope <- floor(d$slope*10)/10
d$midp <- factor(as.character(d$midp))

# reverse the order of the factor
# to have 0 at the bottom of the scale
d$midp <- factor(d$midp, levels = rev(levels(d$midp)))

# plot your stacked histogram
ggplot(d, aes(x=midslope,fill=midp)) +
 geom_bar() +
scale_fill_brewer()Code language: PHP (php)")

