
Spatial mobility always involves at least two types of distances:
- the topographical distance traveled on the surface of the Earth and
- the time distance taken to do so.
GéoRécits3D allows you to map both in a “space-time aquarium” (a cuboid with one dimension dedicated to time). It is written using HTML5 and JavaScript, and uses the visualisation frameworks D3js (version 5) and threejs.
To draw your own maps, just change the places and the movements lists, recorded in CSV files in the data folder of the downloaded app. The lists have the same form as those of GéoRécits.
- See a runninng example GéoRécits3D HERE. (can take a minute to load)
- To make your own map, download GéoRécits from its GitHub repository. See the configuration instructions below.
Preliminary thoughts

Since the 1970s, time geography maps individual journeys in the euclidian space with one dimension dedicated to time. In a 2d visualization like the one above, diagonal lines represent possible or realized movements. The space-time prism reflects possible mobility of an individual. Overlapping space-time prisms show possible encounters between individuals staying in nearby places. Time geography calls such overlaps “pockets of local order“.
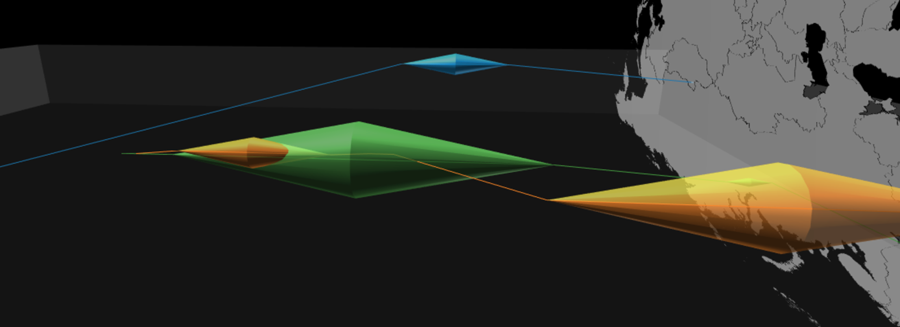
GéoRécits takes these concepts into the third dimension, inspired by more recent works in time geography, adding 3-dimensional space-time prisms.

How do I make my own map?
Finding and editing places, movements and the basemap
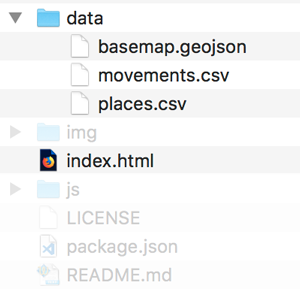
Apart from index.html, GéoRécits3D needs data stored in the data folder of the downloaded application:
- basemap.geojson is a vector basemap. The current example provides a basic base-map for the world countries. You can replace it by any other basemap in GeoJSON format, renamed basemao.geojson. To produce one, use for example QGIS.
- places.csv lists all places of interest.
- movements.csv lists the movements of individuals from place to place.
Just edit any of these files, reopen index.html and you will see an updated map.
places.csv
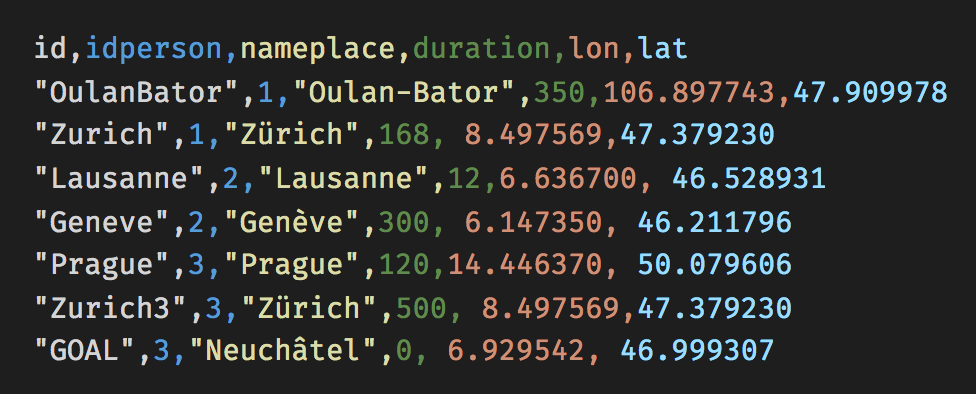
id
All places id‘s need to be unique. If person “1” and person “3” have both traveled through Zurich, you need to distinguish Zurich and Zurich3; nevertheless, both cities can have the same value for nameplace.
idperson
The column idperson distinguishes individuals. It does not have to be numeric, but must be consistent with id’s given by the idperson column in movemets.csv.
duration
The column duration gives the time spent by a person in a given place. For example, person “1” has spent 168 hours in Zurich and person “3” 500 hours. The unit of time is up to your choice: minutes, days, moths… as long as the units are consistent across all places and movements.
lat and lon
These are coordinates in longitude and latitude. You can obtain them with a geocoding app, or find them out individually, by using a service like OpenStreetMap or GoogleMaps, where a click on the map reveals its coordinate.

Note that GoogMaps gives coordinates in the format lat,lon. In places.csv, the columns lat and lon can appear in any order. Just make sure you copy the numbers to the appropriate columns.
movements.csv
The movements.csv file looks like this:

source and target
From where to where a person is moving. The first movement line for a given idperson is the starting point of that person.
idperson
Equivalent to idperson in places.csv.
time
Equivalent to duration in places.csv. Again the unit of time is up to your choice: minutes, days, months… as long as the units are consistent across all places and movements.
Further reading
- Hägerstrand, T. (1970). What about people in Regional Science? Papers of the Regional Science Association, 24(1), 6‑21.
- Mei-Po Kwan & Jiyeong Lee (2004) “Geovisualization of Human Activity Patterns Using 3D GIS:A Time-Geographic Approach” in Goodchild M. and Janelle D. (eds.), Spatially IntegratedSocial Science, Oxford University Press.
- Ourednik, A. (2010). L’habitant et la cohabitation dans les modèles de l’espace habité (PhD). EPFL, Lausanne.
- Poncet, P. (2008) « Visions du Monde » in Lévy J. (dir.), 2008, L’invention du Monde, Paris : Les Presses Sciences Po.
 avec R")

