L’agence fédérale ICE détournée comme outil de répression domestique? – un regard cartographique

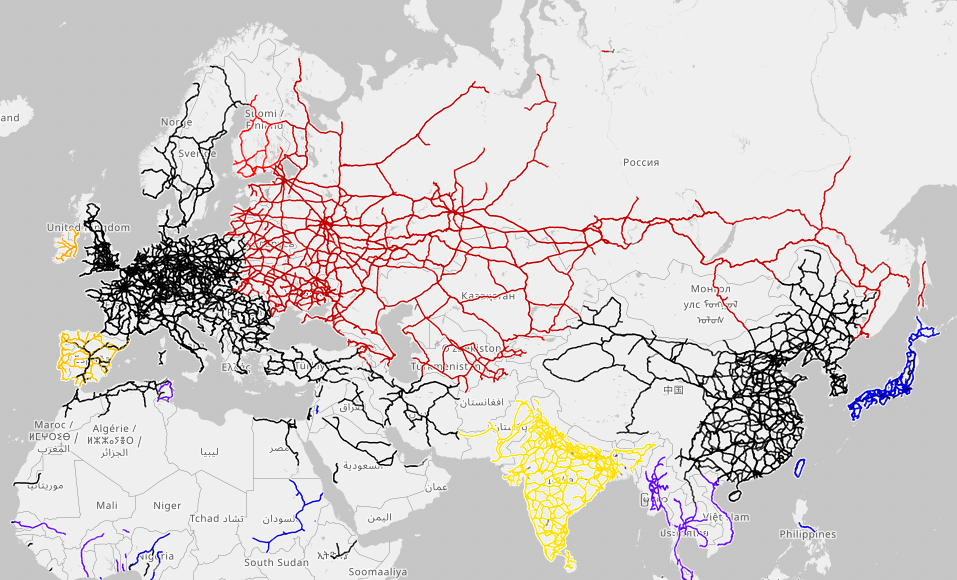
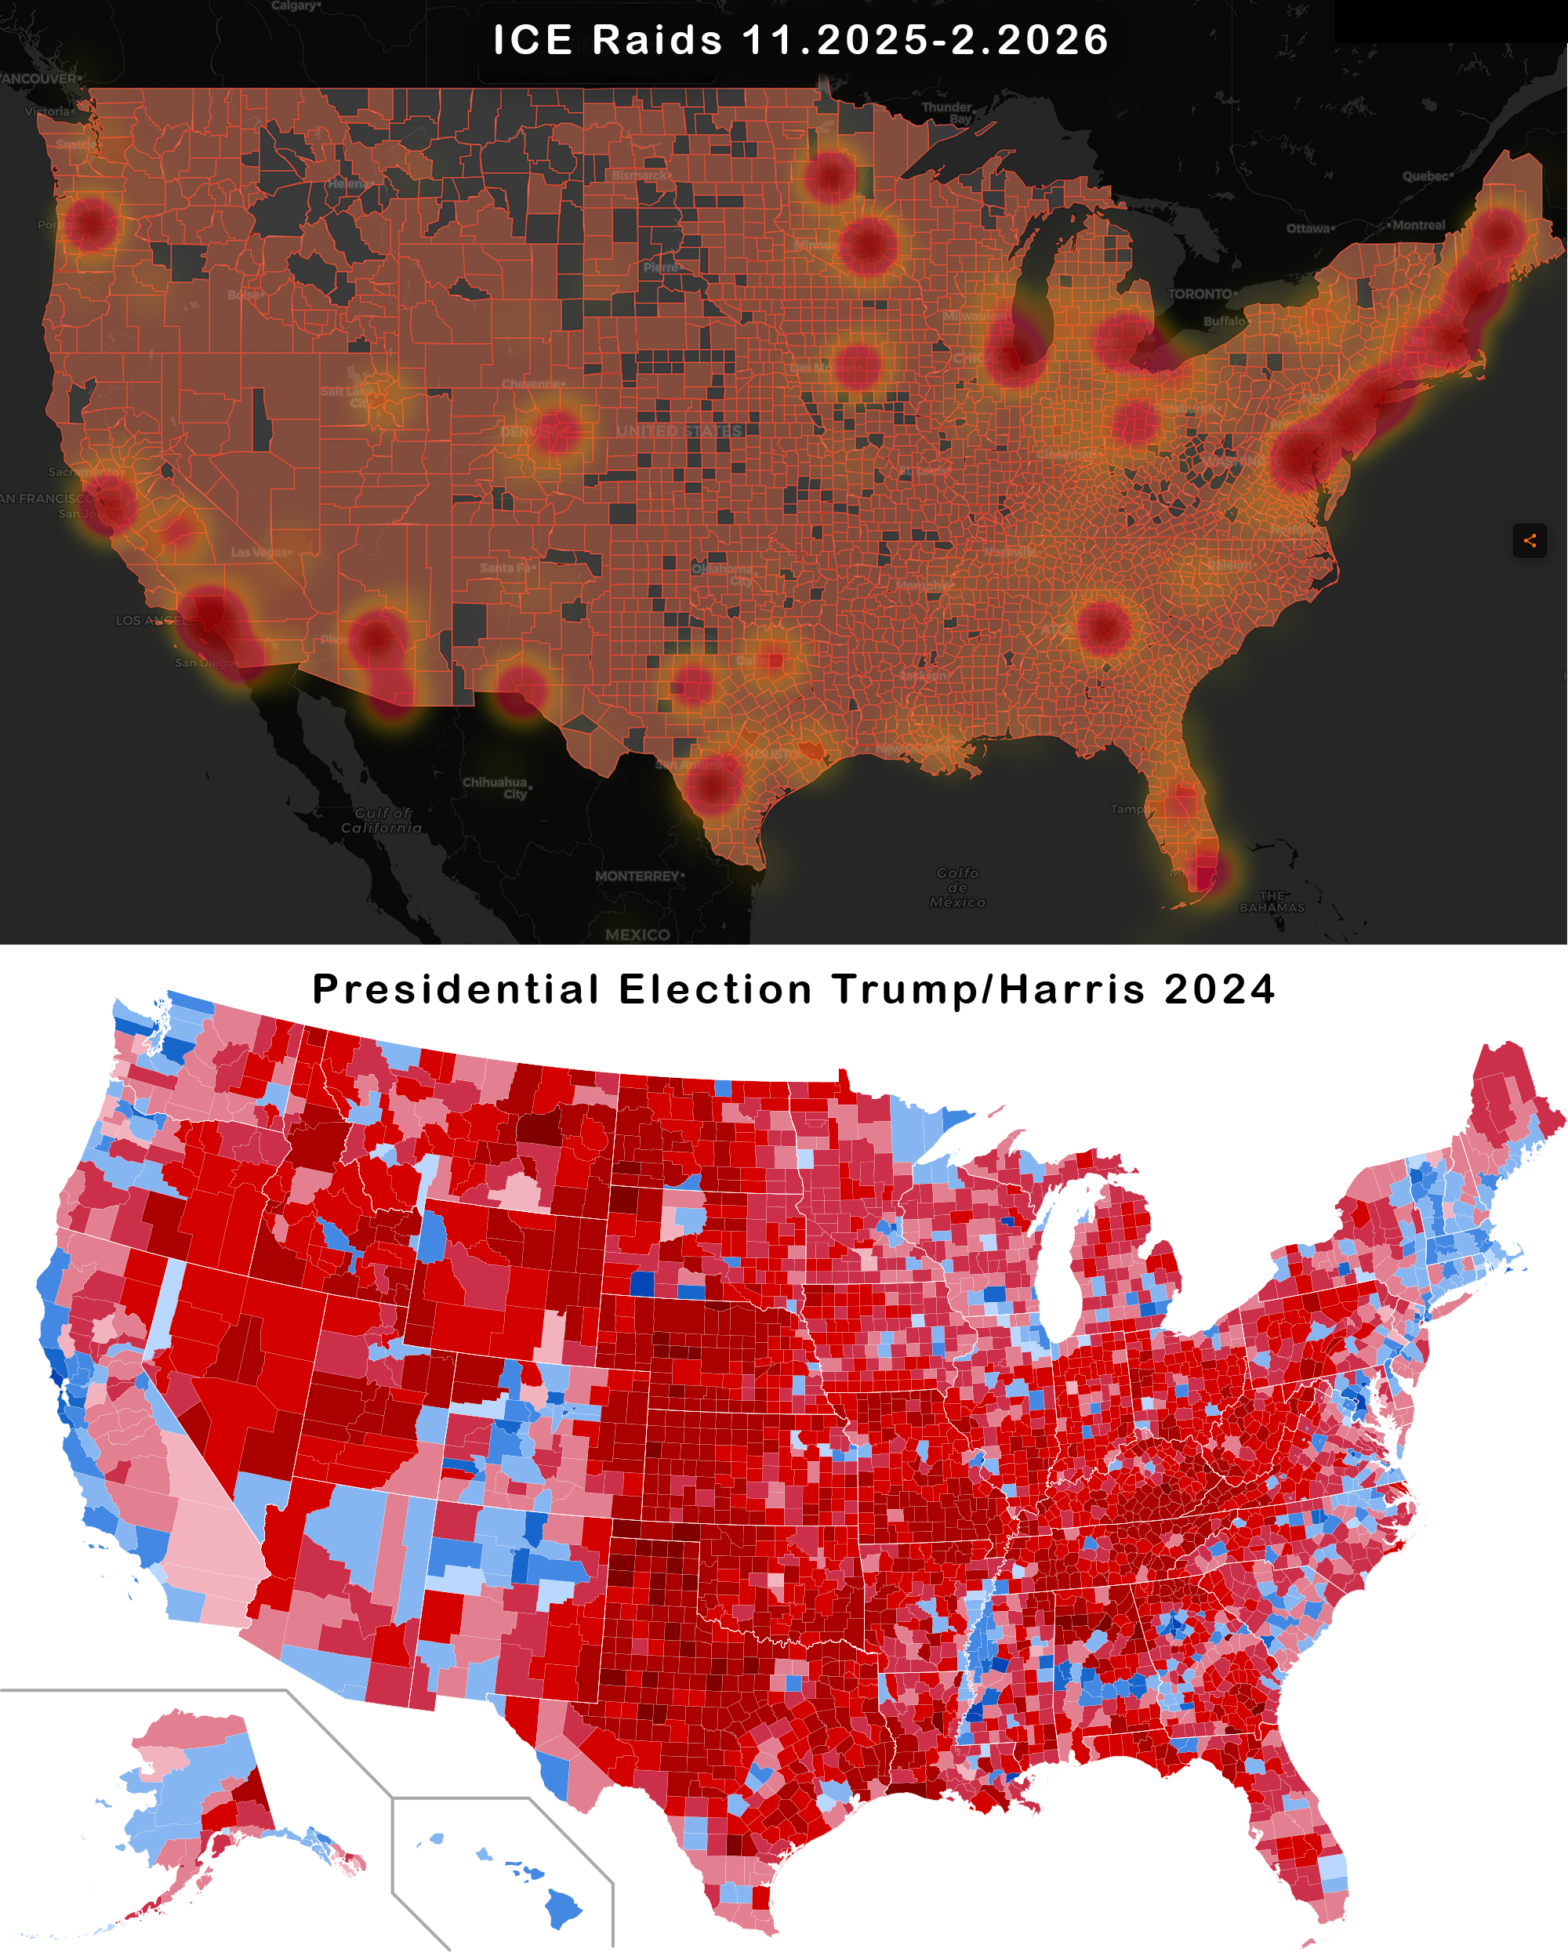
L’agence fédérale ICE, aux USA, mène actuellement une campagne de déportation voulue massive. Ses effets concrets suggèrent toutefois que son but serait aussi, voire surtout, d’intimider les opposant·e·s politiques du président Trump. Une comparaison des cartes électorales avec celle des activités ICE corrobore cette hypothèse.

Notons en préambule que la carte est compilée à partir de données hétérogènes à l’aide […] Continue Reading…

OuroborosTree : Visual Data Exploration for Biosphere-Conscious Nutrion

OUROBOROS TREE is a visual application for exploring relations between human nutrition and living organisms. I have built it because many contemporary issues can be addressed through a prism of our relationship with “non-humans” (according to Bruno Latour’s terminology). The project is evolving and welcomes feedback from the public.

OurobosTree harmonizes, for the first time, environmental and nutritionist data from […] Continue Reading…

The exponential line of technological progress… really?

A long-term timeline of technology by Max Roser

A couple of days ago, I stumbled on LinkedIn on this image showing a long-term timeline of technological development by Max Roser, founder of Our World in Data.

The graphic is impressively synthetic, and deals beautifully with exponential time scales, both prior and after the modern epoch.

But I am not convinced that […] Continue Reading…

Winding Paths in the Space of Conflicts

I rarely travel by plane but, when I do, I can’t help checking that little screen of bad LEDs at least five times an hour, to see the map of locations miles below. Many of them I’ve never heard of, and most of them I’ll never see. Their names appear on the screen like as many alchemic ingredients: Athens, […] Continue Reading…

Correctly sort Bibliographic Entries with Diacritics in LaTeX (natbib, BibTeX)

LaTeX started as an ASCII thing for English speaking nerds. Only later did people start to use it all over the word, in many languages from Cezch to Hindi. We now have XeTeX and LuaLaTeX. But like the serpent Sesha in the Hindu mythology, some of that early ASCII universe remains, notably in the BibTex part of things.

BibTeX […] Continue Reading…

Climate Change Time Series Visualization with Polar Coordinates in R

This graphic appeared in social media lot in the last days

I wondered how it would render on polar coordinates. So I made an R script to do so. The script is reusable for other data sources as I show below. So reuse, enjoy, and make useful.

The plotting function

seasonplot <- function(tsdata,maintitle,source,legxleft,legxrigth,legytop,legybottom) {
# drawing paremeters
[…] Continue Reading…

Railway Track Gauge: a Material Substrate of Nostalgia and Defiance

Railway track gauge in Eurasia and North Africa. Source: openrailway.org

A look at the global map of rail track gauges immediately reminds you of the current invasion of Ukraine. There is a material substrate of the putinist nostalgia of the Muscovite Empire. Far more than a purported linguistic or cultural proximity of the ex-Soviet states, this substrate of steel […] Continue Reading…

The Man from the Future: The Visionary Life of John Von Neumann – a Foreword

I’ve had the pleasure to write a foreword of the French translation of Ananyo Bhattacharya’s biography of John von Neumann, translated by Anatole Muchnik and now published by Quanto.

You can read the French introduction and have a peek at the book’s first chapter (PDF).

In agreement with Ananyo, here is the English translation.

As you read the biography of […] Continue Reading…