The digital height model DHM25 is a set of data representing the 3D form of the earth’s surface without vegetation and buildings. It is essentially based on the Swiss National Map 1:25 000. Years ago, when Swisstopo was called Bundesamt für Landestopographie, they published this data in their home-made format called MMBLT, stored in files […]
Category Archives: Tools
Unlock files that ArcMap forgot to unlock
ArcMap has the bad habit of forgetting to unlock files that you remove from a project. I have lost hours, as the only solution to remove unwanted locks seemed to be shutting down ArcMap, modifying the file, then restarting ArcMap (that takes at least a minute to load each time). Nothing seemed to help until […]
Restore “New > Text file” in Windows’ contextual menu
If you’ve changed your standard .tex file editor to Notepad2 or Notepad++, chances are that the contextual menu entry “Create New > Document file” has disappeared. To restore it, just save the following code as a .reg file and run it (thanks to Archos alias Limneos for posting the code on a SevenForums): Windows Registry […]
I want Windows 7 to sort my files alphabetically, and I mean from 0 to z!
I want Windows 7 to sort my files alphabetically, and I mean alphanumerically, from 0 to z, in ASCII order. Windows 7 acts way too smart sorting files by names to my taste. On more ancient versions of Windows (e.g. Windows 2000) the sorting order would be something like this: Ie4_01 Ie4_128 Ie401sp2 Ie5 Ie501sp2 […]
Colored proportional circles in ArcMap
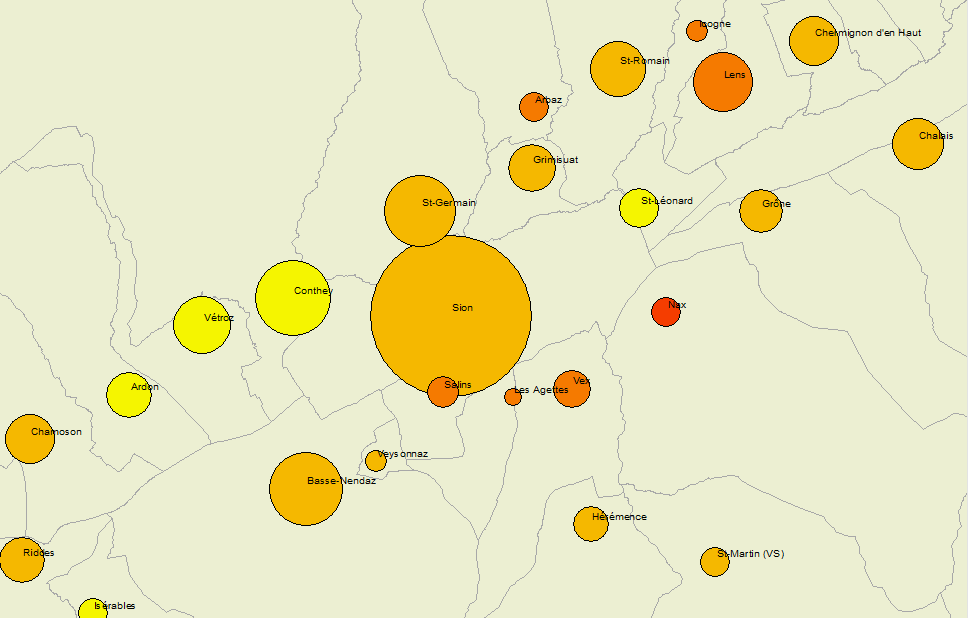
Bivariate thematic mapping with ArcMap? Yes you can! Of course, you could also do it in D3.js (including a nice self-generated legend), or with much less effort in Quantum GIS (post in French). Whatever method you choose, colored proportional circles cannot be drawn directly on polygons, but you can draw them on points. Thus, all […]
A mobility network
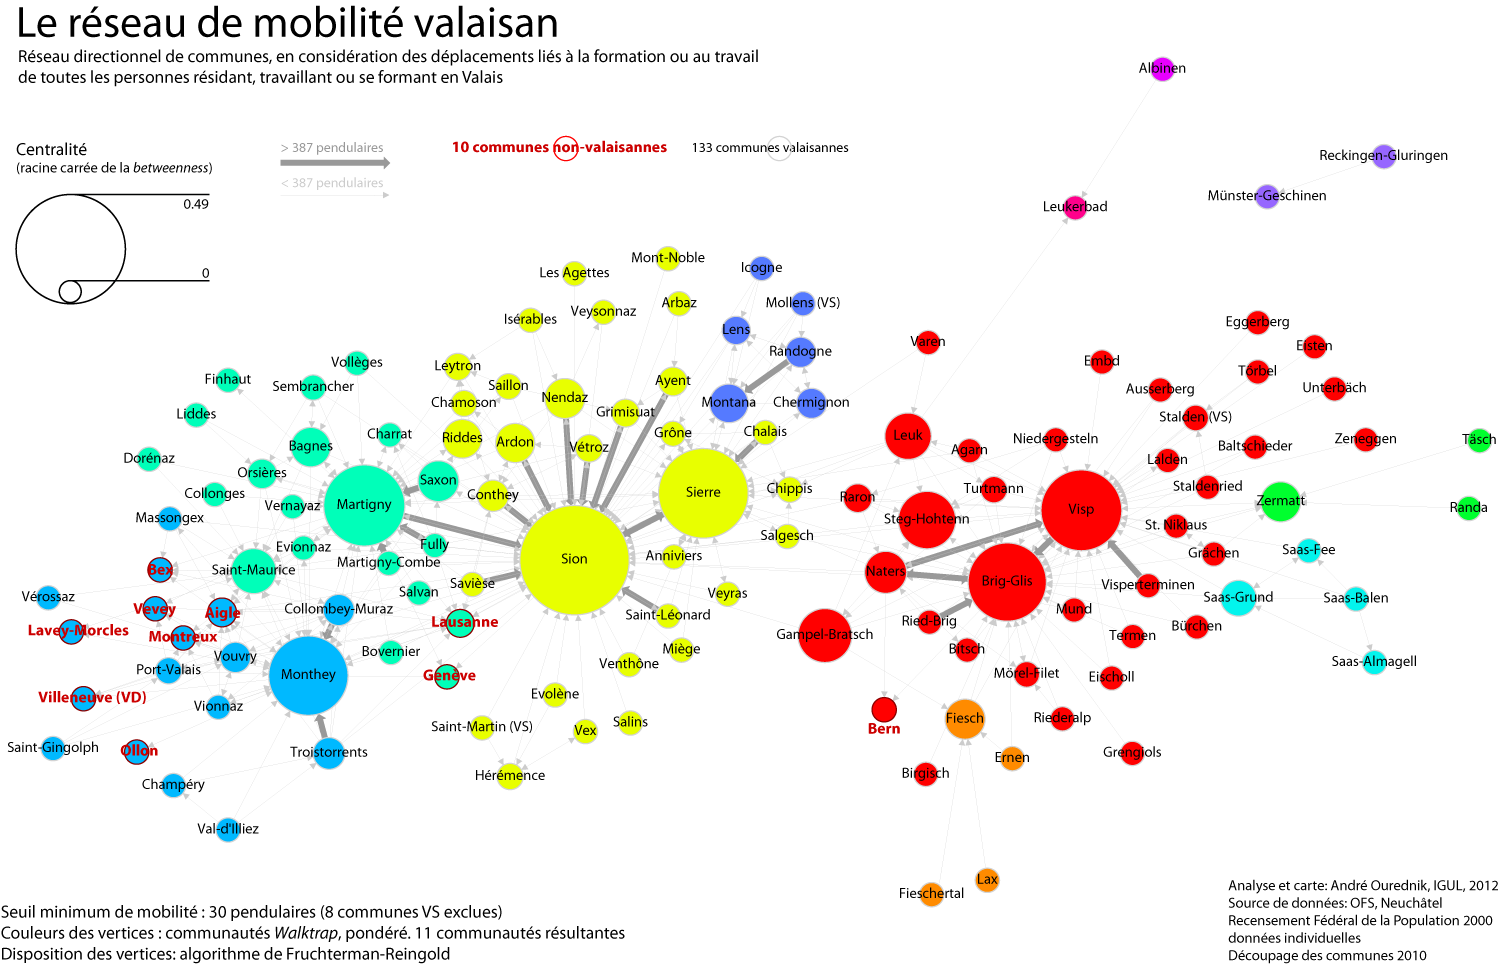
Methods and tools After a day and a half of work and fine-tuning, here we go: the commuting network of all individuals either residing, working or studying in the canton Valais. I’ve used R, with the RStudio GUI, and the igraph library for R. My staring point was the mobility matrix between all communes, including […]
Crop an image in Adobe Illustrator CS3 or later
When you export maps from ESRI ArcMap to Adobe Illustrator, the raster background is by default exported as a series of associated bitmap strips, with superposed vector polygons.Here an example: In this – as in many other situations – you might need to crop the image to a specific area. Say the following rectangle: To […]
RStudio – one big step towards user-friendliness of R
R is the greatest open source statiscal programming package around. It is all a mapper need to pretreat data. Yet it suffers from interfaces that are either uggly, tedious to set up, clumsy to use or all of these. After years of glaring at the Windows interface of R, I’ve finally sutmbled upon a nice […]
Change the language to English/US on all slides and boxes in PowerPoint 2007 to 2016
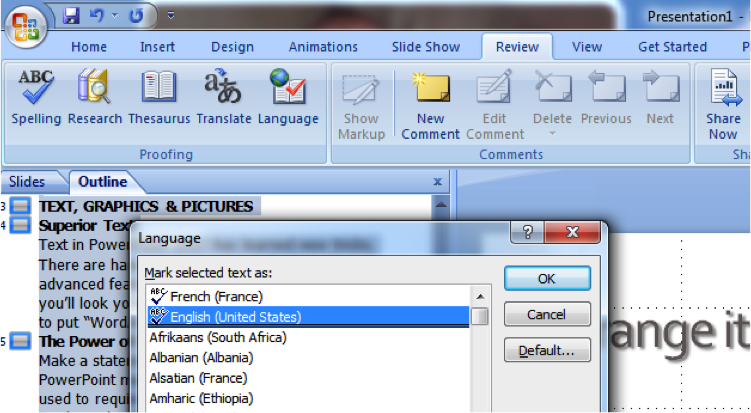
Changing the language of a whole presentation in MS PowerPoint can be tedious. Especially when you translate your slides. You easily end up with a mix of languages on a number of slides. You notice, then, that it is not possible to select the main one: the language button (on the bottom bar) is simply […]
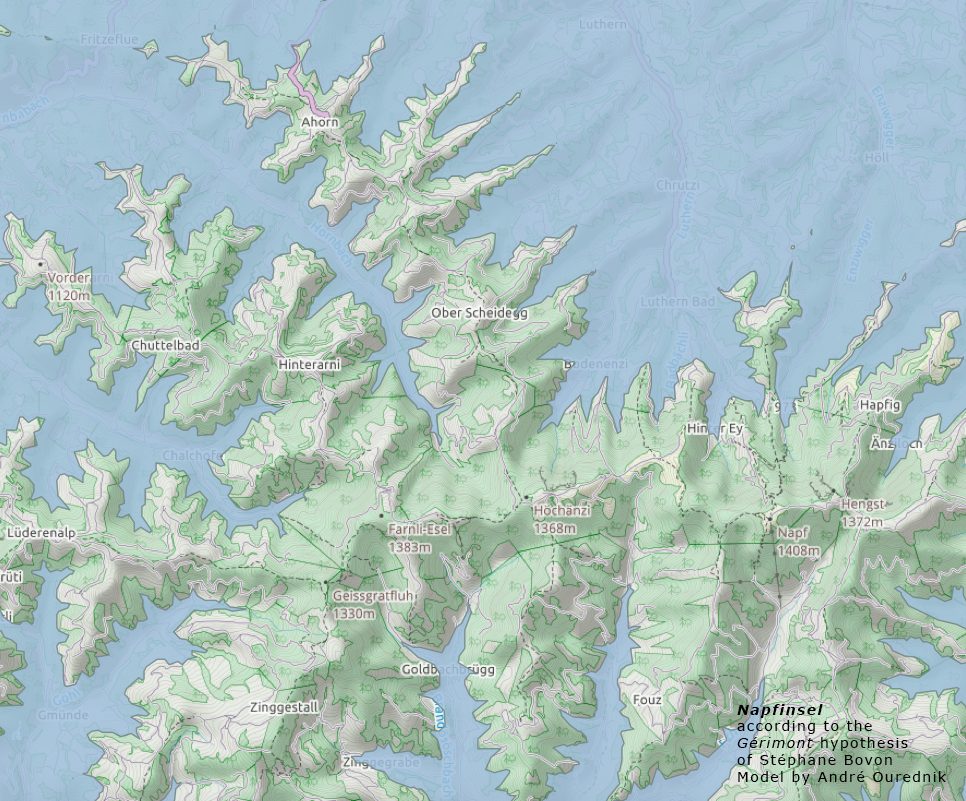
Augmented Reality and the Places of Dreams
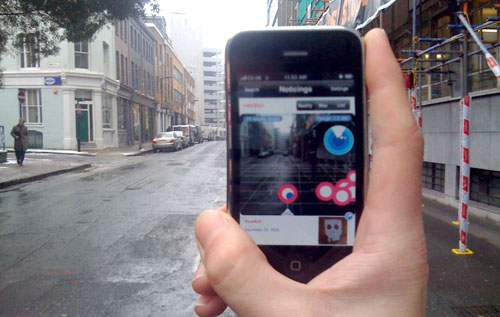
Behind the illusion In Herzog’s Fitzcarraldo, Klaus Kinski with his eyes buried deep into another world stands on the shore of a river and says: Everyday life is only an illusion behind which lies the reality of dreams This is what the Jivaro Indians reportedly believe. But what Kinski’s character sees is his boat climbing […]