Pour certaines cartes, il convient d’utiliser un fond de carte de données vectorielles stockées sur votre ordinateur. D’autres sont disponibles par un service en ligne. Les serveurs WMS Un WMS (Web Map Service) est un protocole de communication standardisé qui permet de diffuser des cartes géographiques sous forme d’images à travers Internet. Plutôt que de […]
Category Archives: Tools
Régression de l’occupation des sols (LUR) avec R
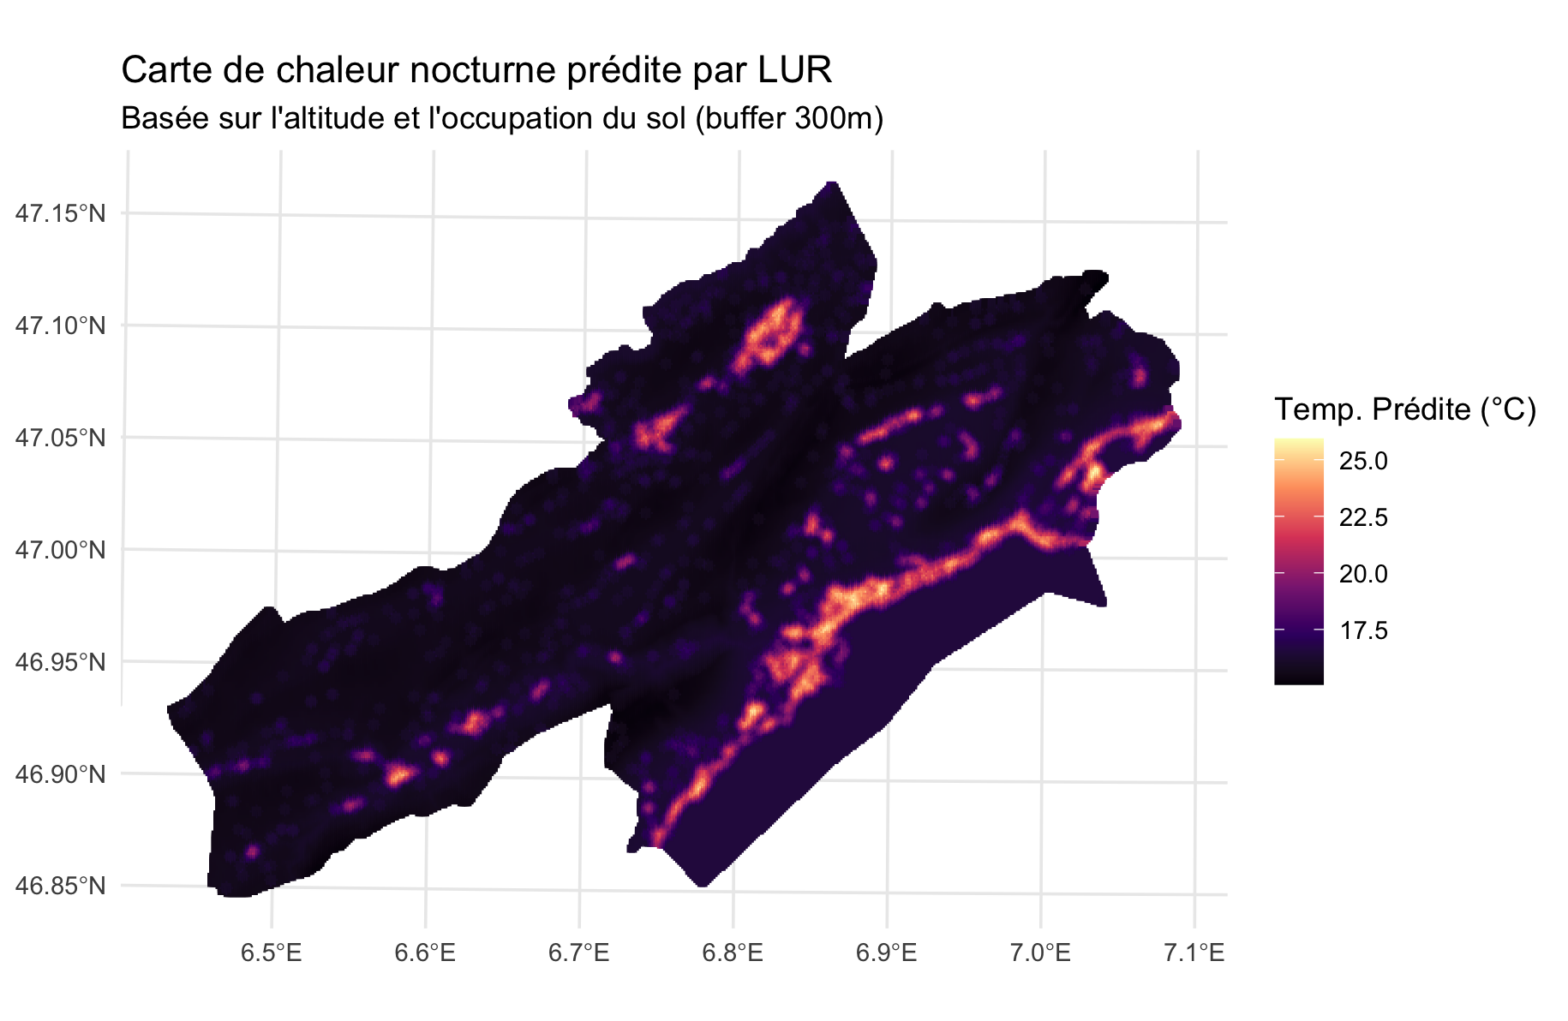
La modélisation par régression de l’occupation des sols (Land Use Regression, LUR) cherche à prédire les valeurs locales d’une variable à partir de caractéristiques environnementales mesurées dans des zones tampons (buffers) autour du lieu de prédiction. La LUR permet de créer des cartes de chaleur (heatmaps) à haute résolution des valeurs de la variable prédite. […]
OuroborosTree : Visual Data Exploration for Biosphere-Conscious Nutrion
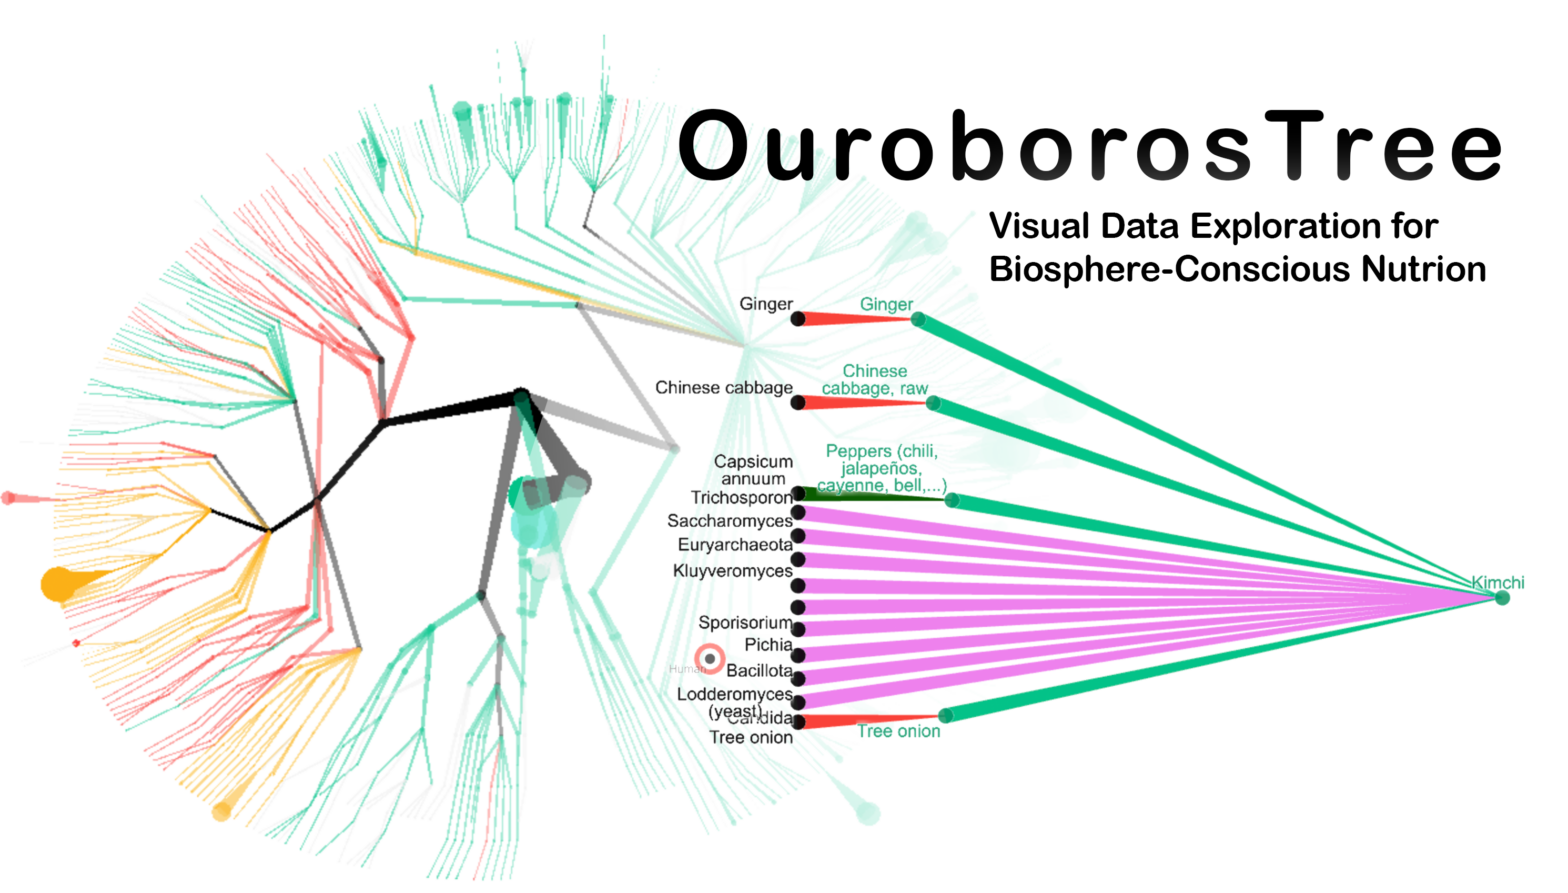
OUROBOROS TREE is a visual application for exploring relations between human nutrition and living organisms. I have built it because many contemporary issues can be addressed through a prism of our relationship with “non-humans” (according to Bruno Latour’s terminology). The project is evolving and welcomes feedback from the public. OurobosTree harmonizes, for the first time, […]
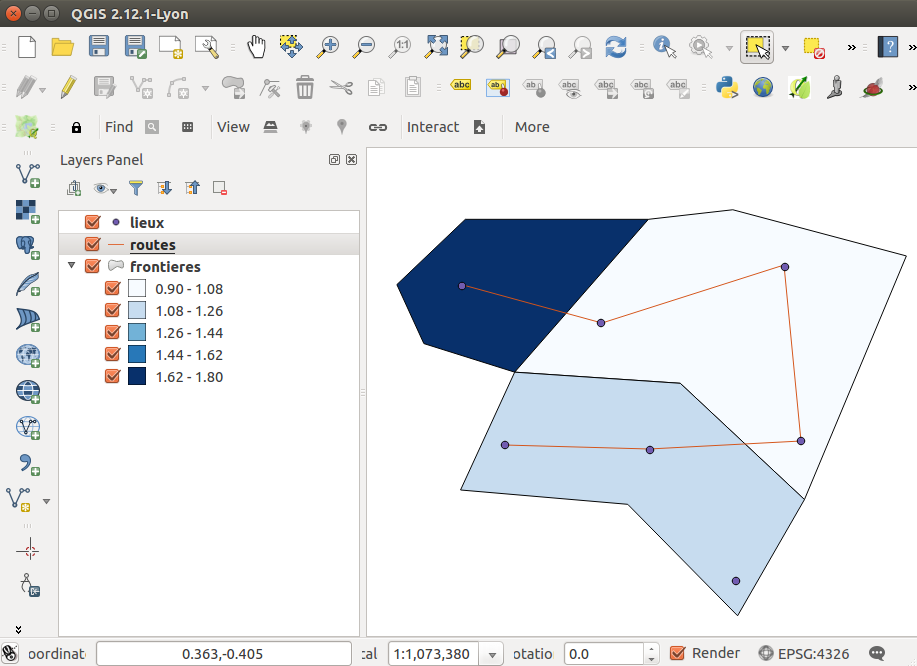
Statistiques zonales et autres agrégations de géodonnées (Qgis, GDAL, R)
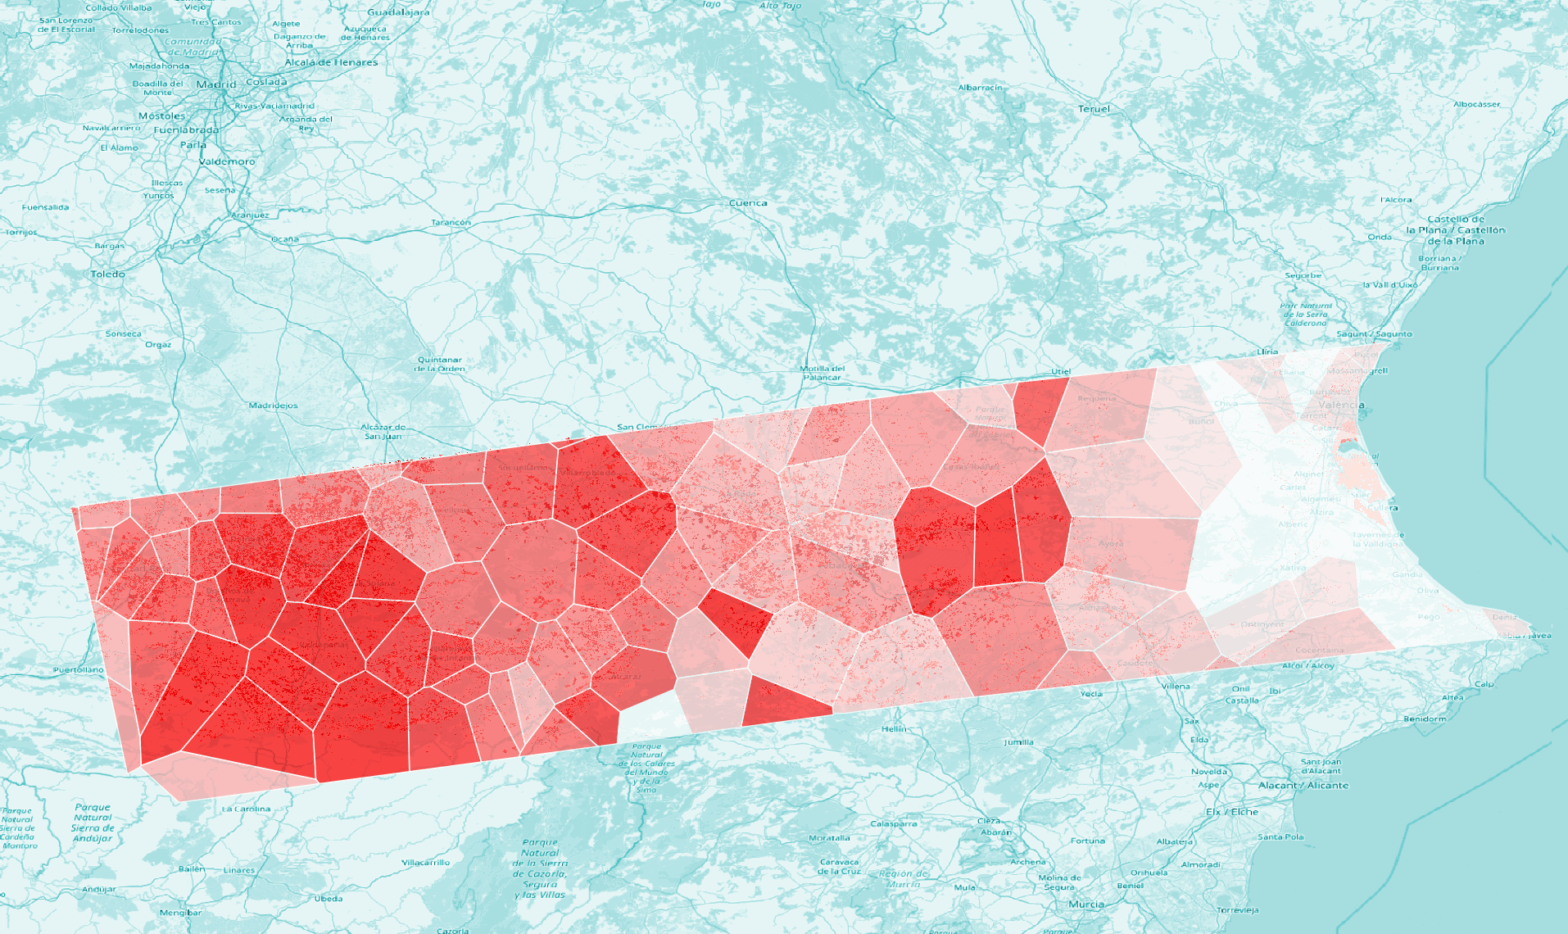
L’objectif de cet exercice est d’apprendre les rudiments de l’agrégation de données en géomatique. Nous agrégerons des données vectorielles ponctuelles dans des zones (polygones), puis nous apprendrons à générer une statistique zonale à partir de données raster. Nous verrons aussi comment préparer les données raster pour rendre une statistique zonale possible. Données de test et […]
Du texte à partir de l’audio
Une étude de terrain en sciences humaines génère souvent une grande quantité de fichiers audio qu’il dont il convient de fournir la transcription – anonymisée – dans votre redu. Une transcription vous permettra aussi d’exploiter vos textes à l’aide d’algorithmes de text mining. Les tâches de transcription se laissent automatiser grâce l’intelligence artificielle et ce […]
Topic Modeling: la modélisation thématique avec R, Quanteda… et ChatGPT

Ce tutoriel présuppose que vous avez fait vos premiers pas avec le module R Quanteda et que vous maîtrisez les notions stemming, stopwords, matrice document-terme, etc. On part du principe que vous avez installé et activé les modules quanteda, quanteda.textstats, quanteda.textplots, readtext, seededlda et magrittr. Créez un corpus de textes à partir de données existantes […]
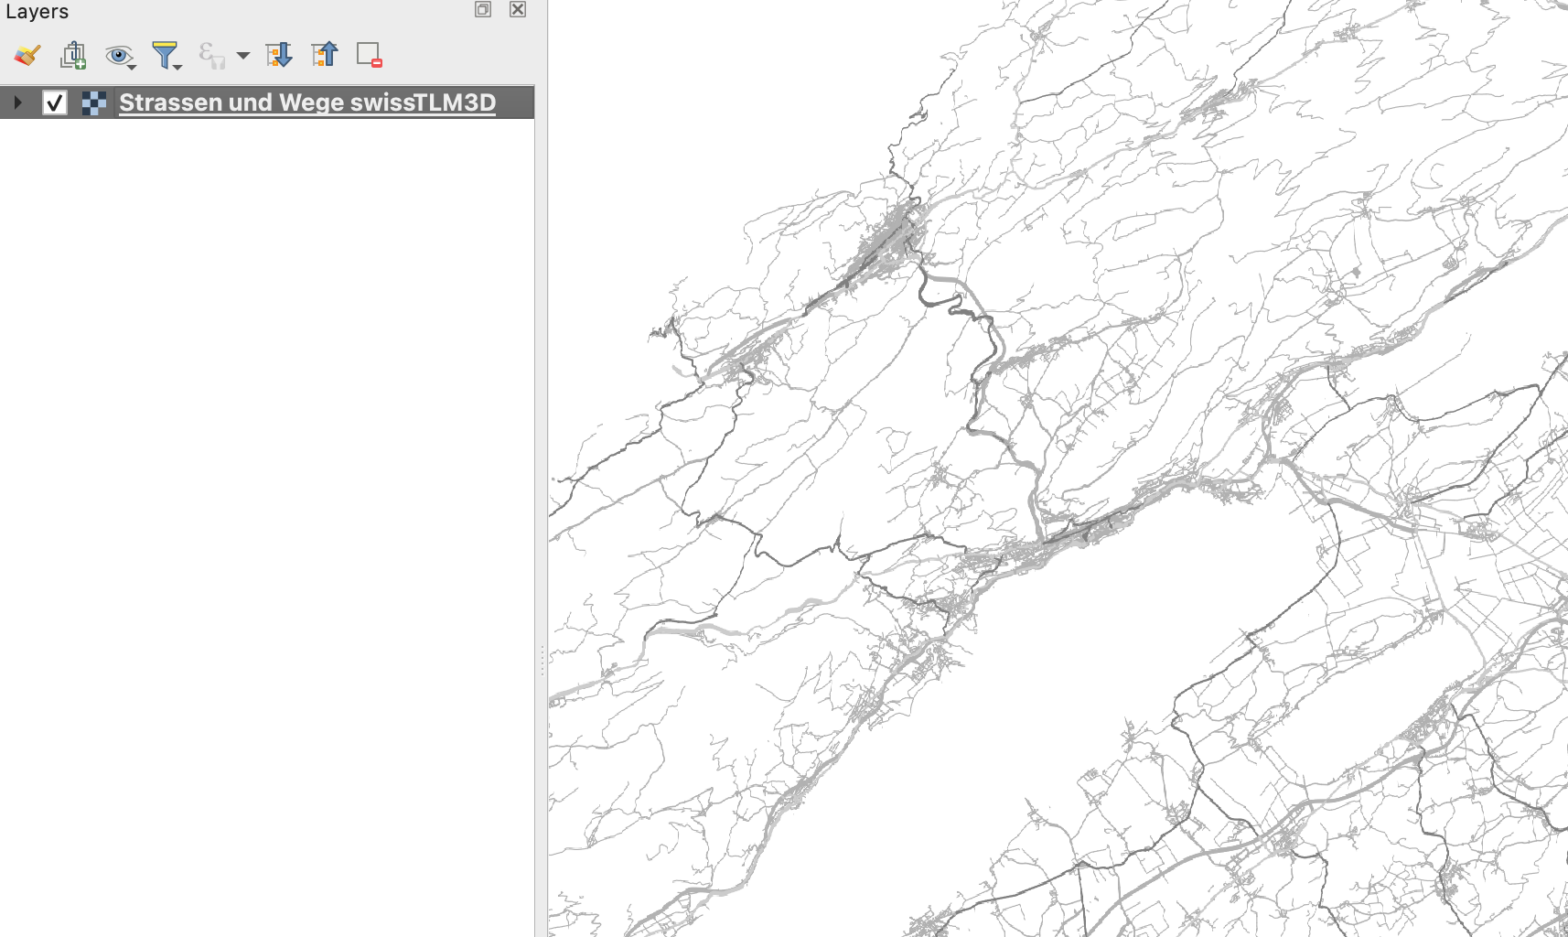
La numérisation vectorielle de géodonnées avec GeoJSON.io et QGIS
Ce tutoriel vous permet de découvrir des outils de base pour la numérisation vectorielle d’un espace géoréférencé à l’aide de la webapp GeoJSON.io et du logiciel open source Quantum GIS. Prérequis Dessin vectoriel vs. vectorisation géoréférencée Dans un outil de dessin vectoriel pur comme Illustrator, Inkscape ou Affinity Designer, les objets que vous dessinez se […]
Division by Zero – Sometimes Usefull

“Zeroworld“, a recent episode of the WNYC podcast Radiolab, examined the possibility of division by zero. The discussion turned mostly metaphysical and got many listeners so angry that they went on to rant on Reddit. I understood this episode more as a fun thought experiment than as a formal proposal. But it also reminded me […]
Correctly sort Bibliographic Entries with Diacritics in LaTeX (natbib, BibTeX)
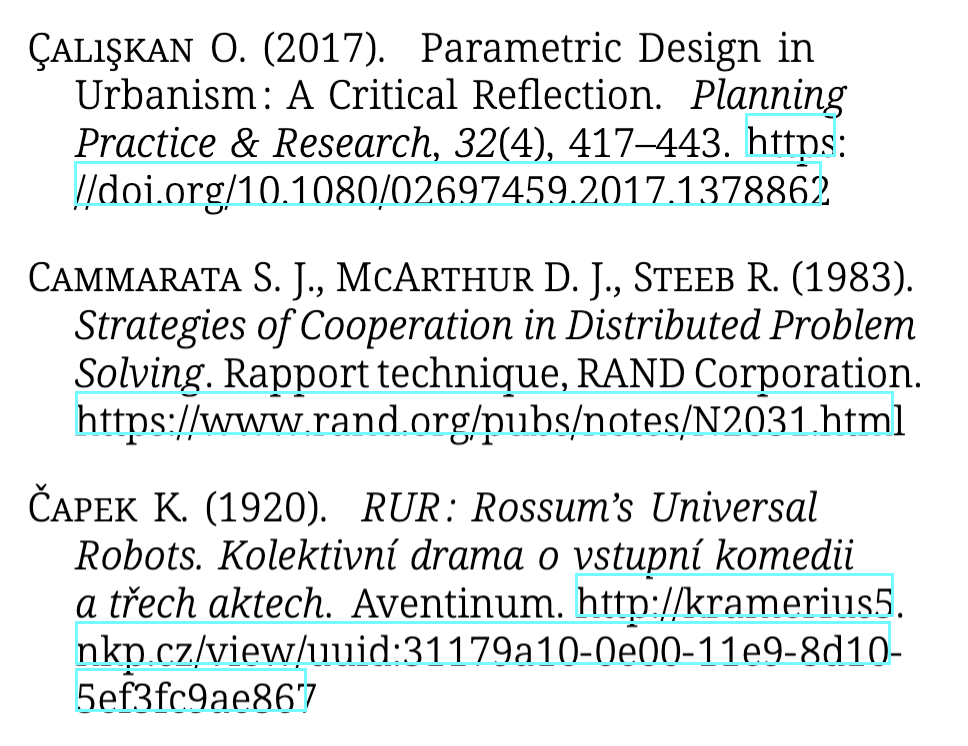
LaTeX started as an ASCII thing for English speaking nerds. Only later did people start to use it all over the word, in many languages from Cezch to Hindi. We now have XeTeX and LuaLaTeX. But like the serpent Sesha in the Hindu mythology, some of that early ASCII universe remains, notably in the BibTex […]
Climate Change Time Series Visualization with Polar Coordinates in R
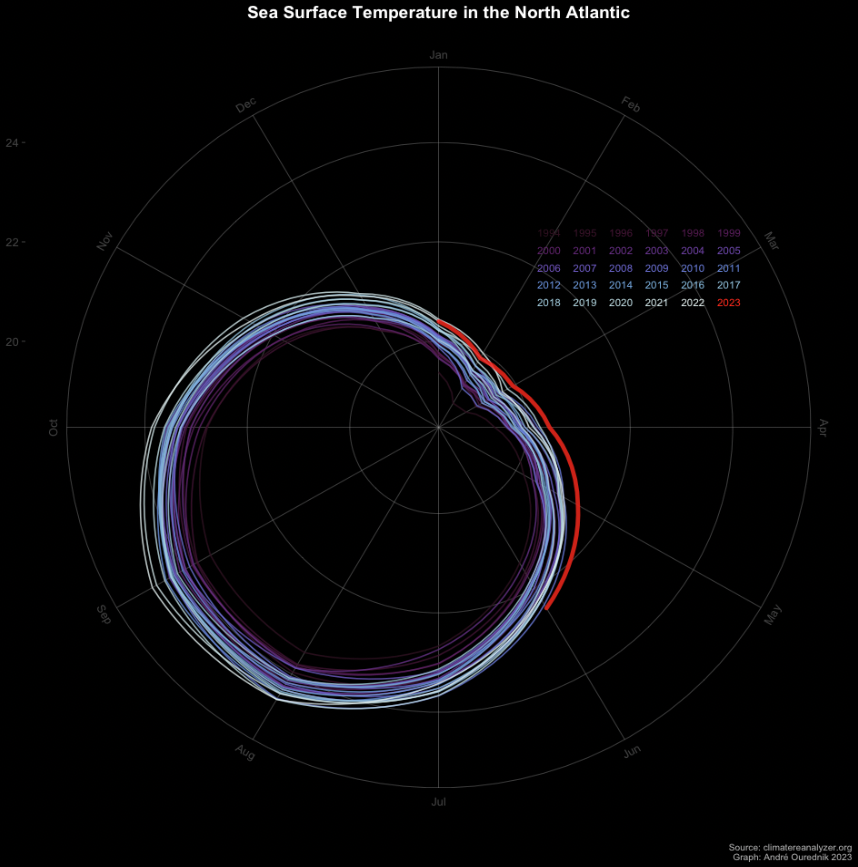
This graphic appeared in social media lot in the last days I wondered how it would render on polar coordinates. So I made an R script to do so. The script is reusable for other data sources as I show below. So reuse, enjoy, and make useful. The plotting function Sea surface tempareature (SST) in […]