GéoRécits allows you to map interviews pertaining to individuals’ mobility. You can compare individual travel journeys made by several individuals and leading to a common final destination – useful in the analysis of migrations – or analyse travel patterns accomlished for a given duration of time.
The two functions of GéoRécits
GéoRécits produces three types of diagrams based on such hinterview data:
- a map based on the topographical distances separating all places
- a time diagram showing individual journeys parallel in time.
- a network map based on the travel time distances separating all places
This allows to map two types of data in space and in time.
Map journeys

To map a travel journey , you can ask an individual the following questions:
- Where did your journey start?
- What was your final destination.
- What are the places where you have passed through ?
- How much time did you take for each traveling etap?
- How much time did you spend in each place?
If several individuals share the same final destination, their paths can be put in parallel.
Map travel patterns
To map a travel pattern, you can ask an individual the following questions:
- What are the places where you have been in the last x years/months/weeks/days ?
- How much time did you spend in each place?
- Where from did you go where to, and how frequently?
- How long did it take you to travel between these places?
Where can I find GéoRécits?
There are two ways to use GéoRécits:
- You can use GéoRécits online. No data is uploaded to any server. GéoRécits is a javascript application that works eentirely in your local browser.
- Or download GéoRécits from its GitHub repository for offline use. See Offline use and advanced configuration below.
Another post is dedicated to a 3D version of GéoRécits.
How do I use GéoRécits?
On startup, GéoRécits shows an example visualization. To map your own journeys or lived spaces, you need to drag&drop two data files to the corresponding drop-zones of the app window:
- places.csv : a table of all places of interest.
- movements.csv : a table of movements of individuals from place to place.
These should be prepared according to your use case. (Note that nothing is uploaded to any server, the application runs client-side, that is, on your computer.)
Use case 1: Traveling to a common destination

As a human geographer, you might interview migrants in order to understand their journey toward a common destination. One of them leaves Ecuador, takes 2 days to reach Mexico and 3 more weeks to reach Tijuana. Then she has to wait before being able to cross the border, after what she takes oe more week to reach New York. Other migrants take distinct routes. Different paths lead across the border. In 1997, the performance artist Francis Alÿs traveled from Tijuana to San Diego through Seoul…
In order to summarize these multiple journeys in GéoRécits, you need to give the application data in csv format. This can be prepared in a preadsheet application like LibreOffice or in any pure text editor like Visual Studio Code. Please create places.csv and movements.csv in the following manner.
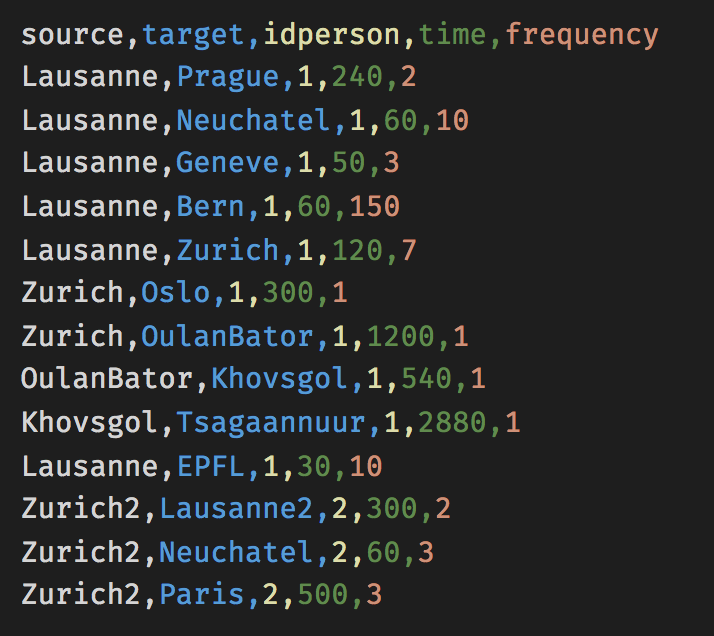
places.csv
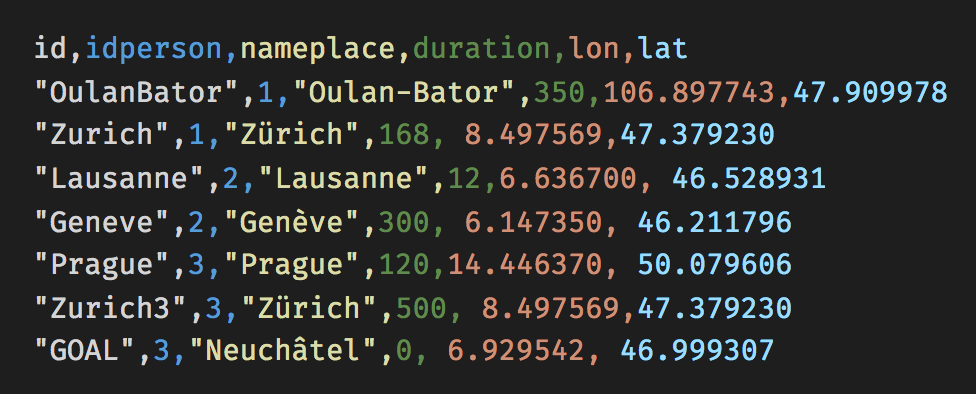
id
All places id‘s need to be unique. If person “1” and person “3” have both traveled through Zurich, you need to distinguish Zurich and Zurich3; nevertheless, both cities can have the same value for nameplace.
One of the id’s is special: named GOAL. This is the place to which all (1, 2 and 3) converge. If you want to map journeys to a common destination, the id GOAL must be used.
idperson
The column idperson distinguishes individuals. It does not have to be numeric, but must be consistent with id’s given by the idperson column in movemets.csv.
duration
The column duration gives the time spent by a person in a given place. For example, person “1” has spent 168 hours in Zurich and person “3” 500 hours. The unit of time is up to your choice: minutes, days, moths… as long as the units are consistent across all places and movements.
lat and lon
These are coordinates in longitude and latitude. You can obtain them with a geocoding app, or find them out individually, by using a service like OpenStreetMap or GoogleMaps, where a click on the map reveals its coordinate.

Note that GoogMaps gives coordinates in the format lat,lon. In places.csv, the columns lat and lon can appear in any order. Just make sure you copy the numbers to the appropriate columns.
movements.csv
The movements.csv file looks like this:

source and target
From where to where a person is moving. The target with id GOAL is the final destination.
idperson
Equivalent to idperson in places.csv.
time
Equivalent to duration in places.csv. Again the unit of time is up to your choice: minutes, days, months… as long as the units are consistent across all places and movements.
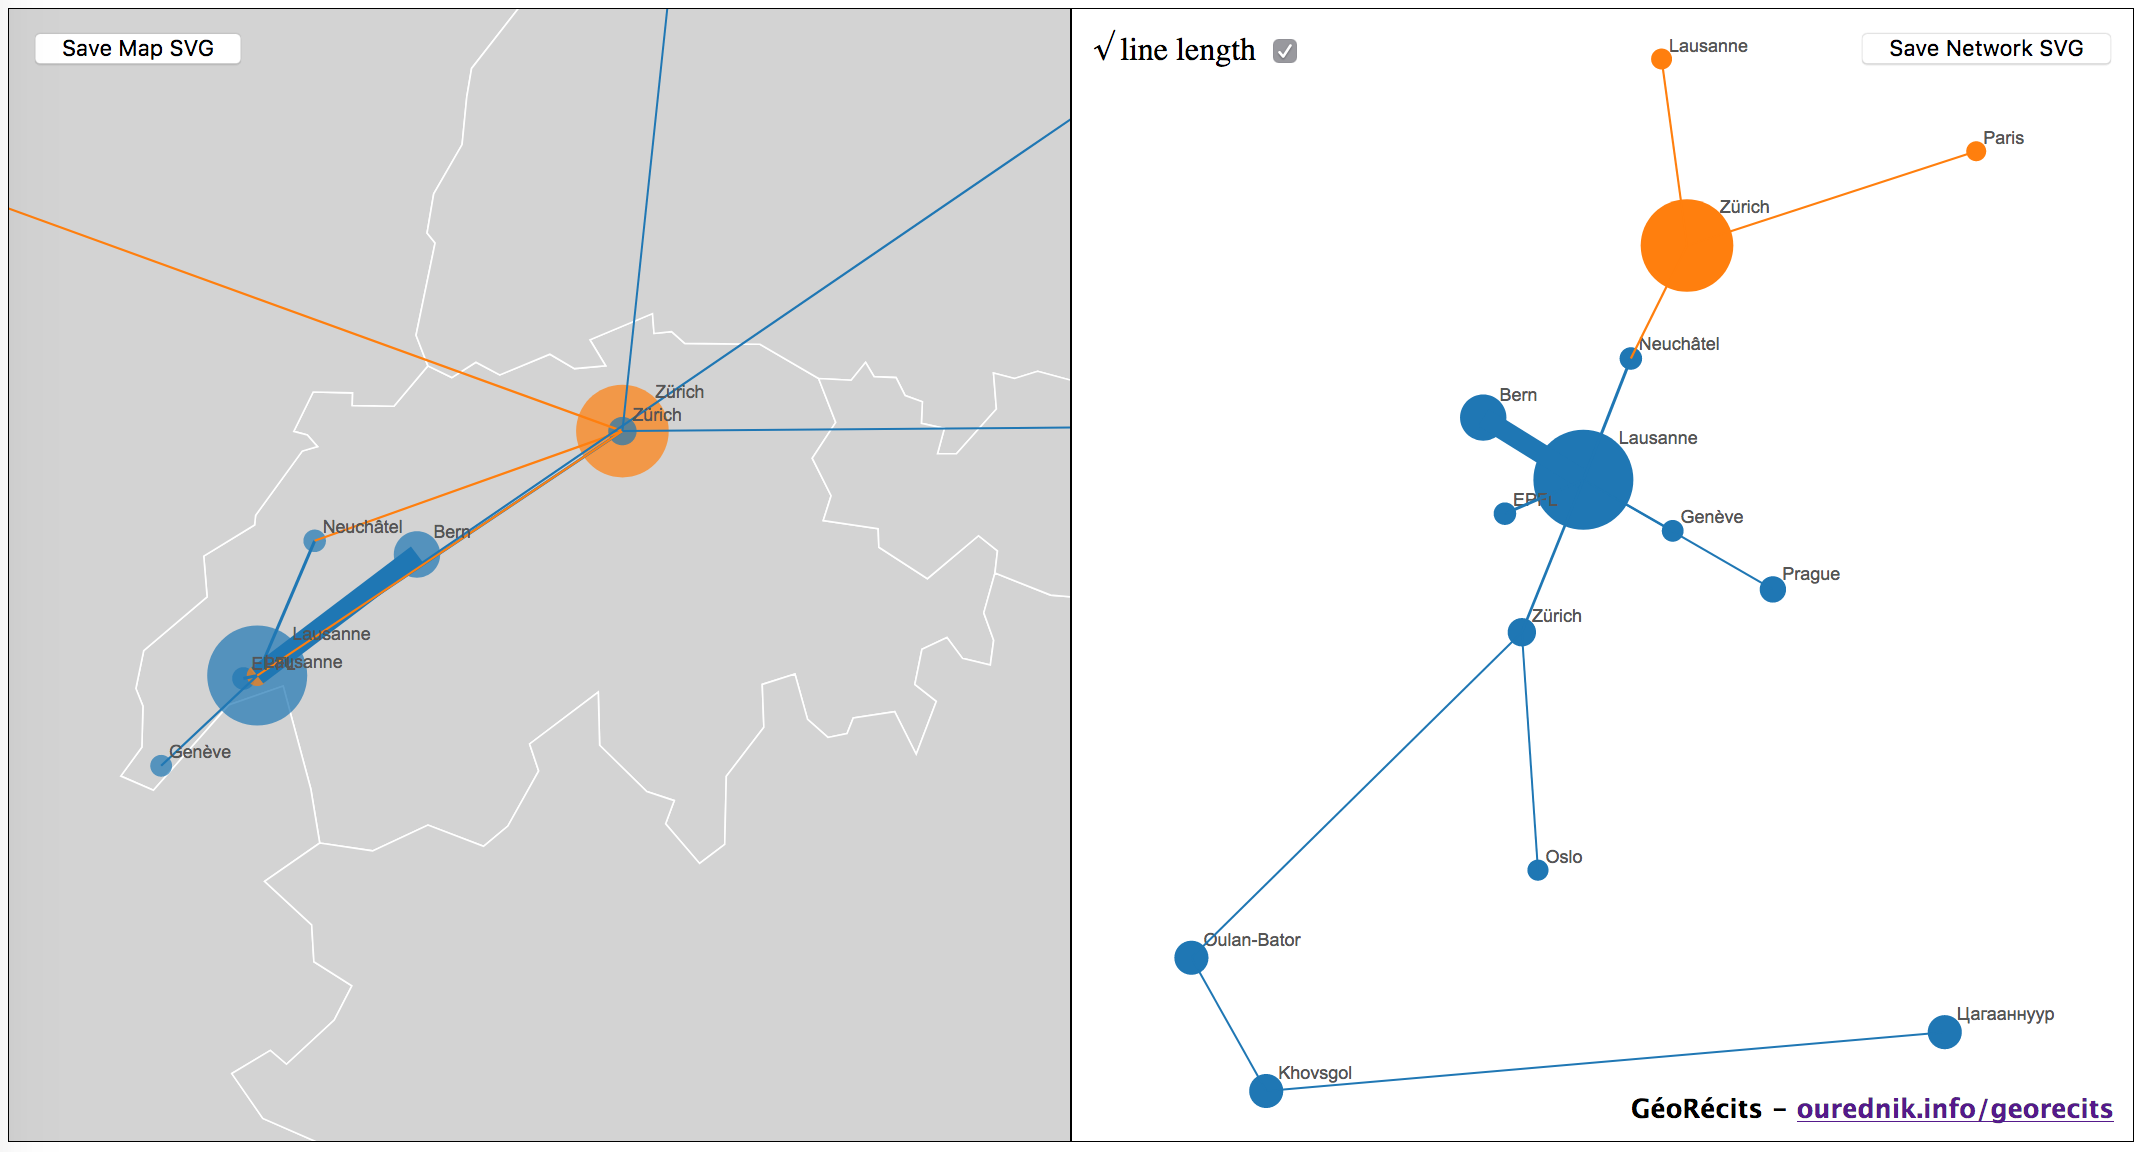
Reading the map
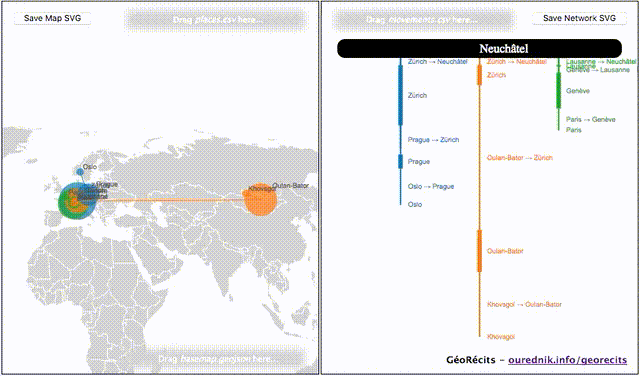
The obtained map consists of 2 visualizations:
- left pane: movements in topographical space,
- right pane: space reduced to a single dimension, time, in vertical. This is inspired by representations in “time geography”, notably Hägerstrand (1970). The journeys of three individuals are compared here.
Use case 2: Mapping the lived space of a person

The industrial era has separated places of residence from places of work. The era of low-cost flight has pushed places of leisure to remote destinations. We live “multilocally” (Fuhrer&Kaiser, 2014).
A way to map this is by the means of an “selfextensive” map, showing the network of places that constitute the lived space of a given person over, her spatial portrait, over a year span, or over her whole lifetime. This type of representation is inspired by the work of the SCALAB team (2004).
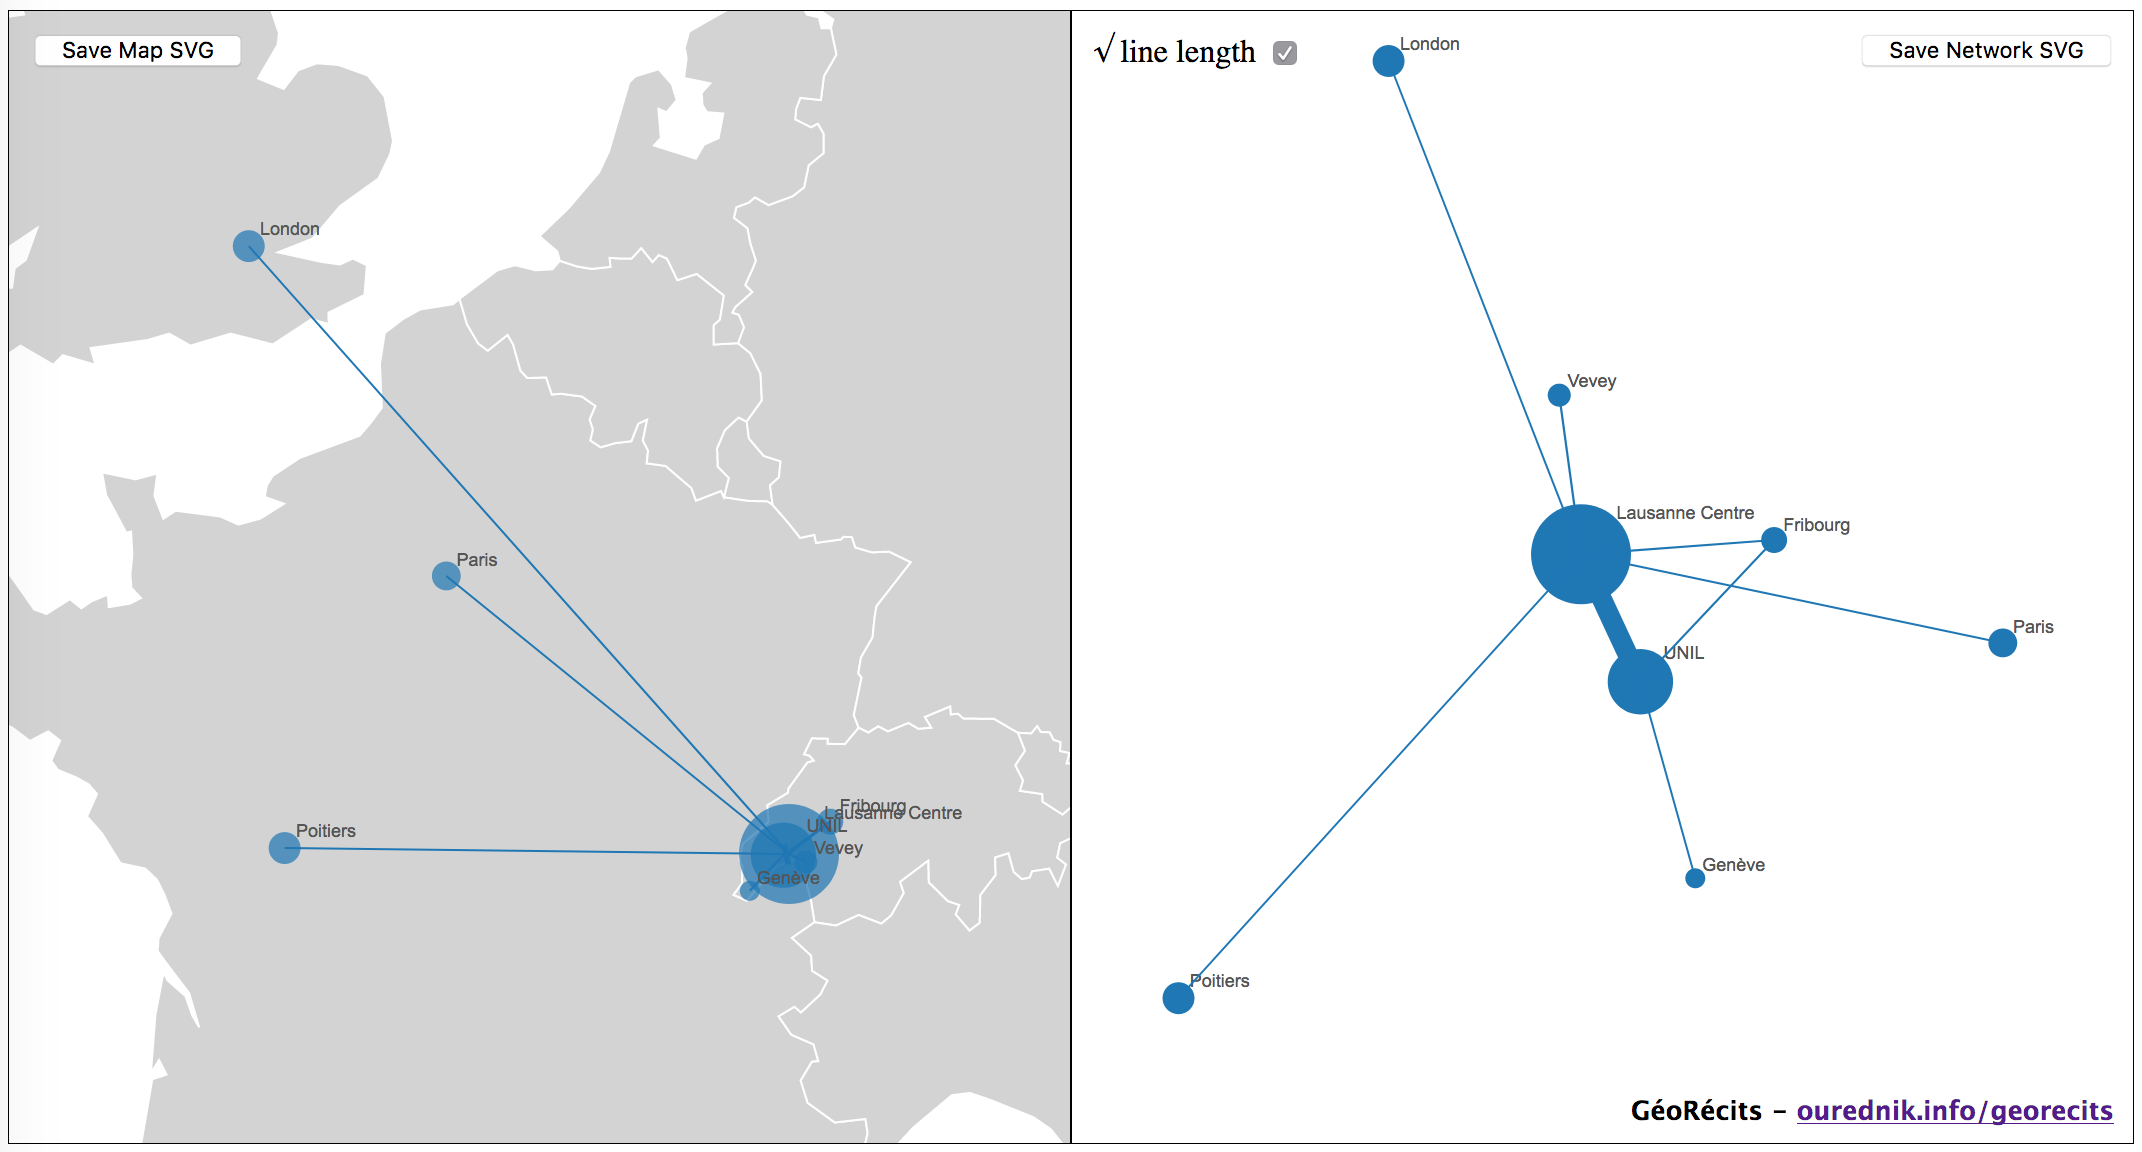
We use circles and lines.
- The circle size shall represent time spent in a given place.
- The line length the time – or other effort – needed to travel from one place to the other.
- The line width shall represent the frequency of the travel.
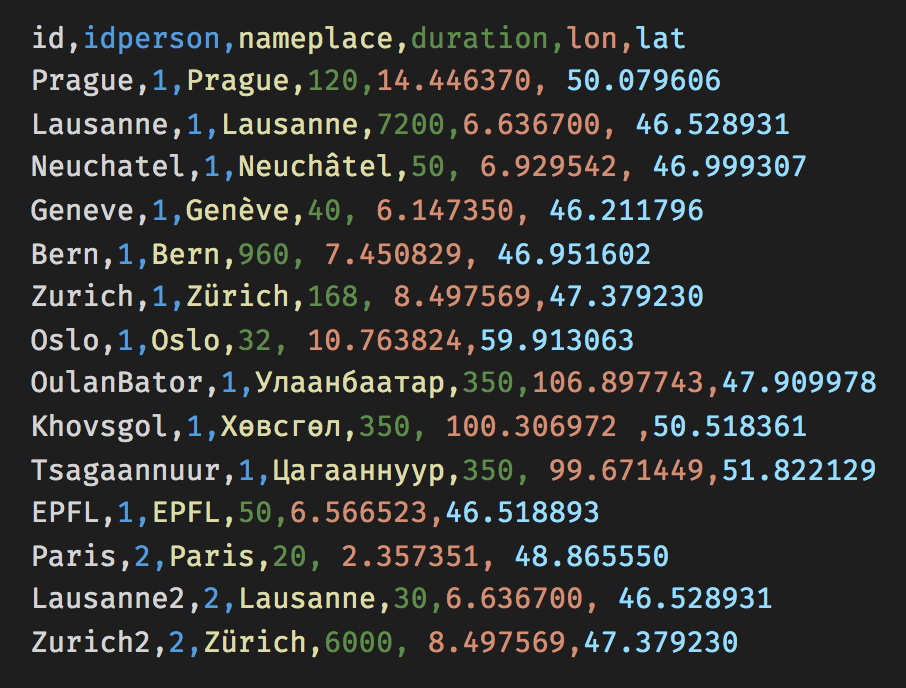
places.csv
The file is configured in the same manner as when illustrating travel to the same destinations. The only, important, difference is that there is no place with the id “GOAL”. GéoRécits takes this into account ad proposes a different map.

movements.csv

frequency
Here also: no mention of “GOAL”. But the file has an extra column: frequency. This counts the travel between places. For example, a person living in Lausanne and working at the UNIL travels 160 times a year from one to the other. A one-time vacation in London has frequency 1.
The map
The portrait of a lived space of a single person.
Use case 3: Mapping the overlapping lived spaces of several people
Sometimes, lived spaces overlap: with friends, students, co-workers, family members. Depending on the perspective, “sharing space” can mean sharing the same city without ever meeting, sharing the same classroom, or sharing a bedroom. The lived spaces of a whole population can be brought together in a single network.
If you are interested in two friends living in different cities and occasionally meeting in a third one, your configuration might look like this.
places.csv
movements.csv
Note that both people, 1 and 2, travel to a place with id “Neuchatel”. Both also travel to the city of Zurich, but never meet there. Person 1 travels from Lausanne to Zurich 7 times a year. Person 2 lives in Zurich2 and travels frequently from there to other destinations.
Offline use and advanced configuration
GéoRécits is written in HTML, SVG and JavaScript. It uses the visualization framework D3js, version 5. It is open source, licensed under GNU GPL. It can be run online, or downloaded, forked or cloned from the GéoRécits GitHub repository.
On Firefox and MS Edge
To use the downloaded app offline, in Firefox or MS Edge, simply open index.html with one of these browsers.
On Chrome and Safari
Chrome and Safari will not let the program run locally, because they do not allow local javascript to fetch local files, for odd security reasons. A workaround is to run a local server. A simple way to do so on a Mac is to open your terminal and type:
cd /Users/your_user_name/path_to_georecits
python -m SimpleHTTPServer
After that, open Chrome or Safari and navigate to the address localhost:8000

Finding and editing places, movements and the basemap
Apart from index.html, GéoRécits needs data stored in the data folder:
- basemap.geojson is a vector basemap. The current example provides a basic base-map for the world countries. You can of course change it for any other basemap in GeoJSON format. To produce one, use for example QGIS.
- places.csv lists all places of iterest.
- movements.csv lists the movements of individuals from place to place.
Just edit any of these files, reopen index.html and you will see an updated map.

Moving the map
You can move the map and zoom with the mouse or pad. In the network view, you can move around individual places.
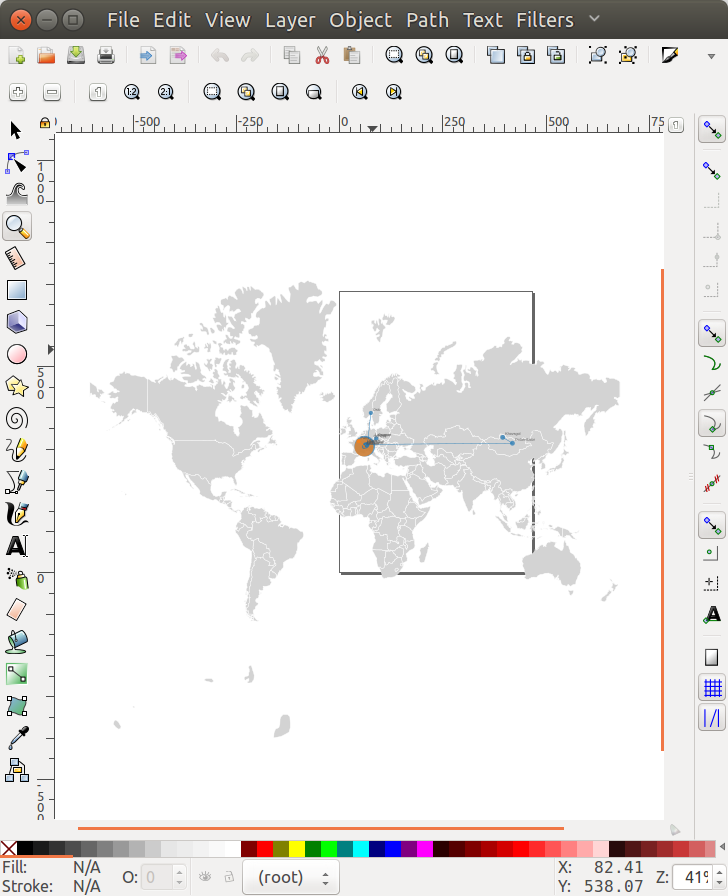
Exporting as SVG
With the buttons Save Map SVG and Save Network SVG, you can export both representations as images that can be opened in Inkscape or Illustrator CC. Note that Illustrator CS6 and below has a bug and does not correctly open SVG files.


The rationale behind this representation
Space cannot be reduced to time only. As Claude Lévi-Strauss puts it:
“Travelling is generally thought of as moving through space. This is not much. A journey is simultaneously inscribed in space, time and social hierarchy. Each impression is only definable by relating it integrally to these three axes, and since space alone has three dimensions, it would take at least five to make an adequate representation of travel. [On conçoit généralement les voyages comme un déplacement dans l’espace. C’est peu. Un voyage s’inscrit simultanément dans l’espace, dans le temps et dans la hiérarchie sociale. Chaque impression n’est définissable qu’en la rapportant solidairement à ces trois axes, et comme l’espace possède à lui seul trois dimensions, il en faudrait au moins cinq pour se faire du voyage une représentation adéquate.]
Claude Lévi-Strauss, 1955, Tristes Tropiques.
One can even consider distance in terms of costs or psychological effort, as suggested for instance by the phenomenologist Otto Friedrich Bollnow:
How great is the concrete lived distance between a point on a wall of my home, to the point straight through on the other side of the wall in my neighbor’s home?
Mathematically, depending upon the thickness of the wall, it may be a half-meter.
Concretely, it will be much farther, for to reach it I have to leave my room, my house, and go out on the street to my neighbor’s house. Then if I am not well acquainted with this neighbor he may make such a wry face at my question that I may prefer not to ask it at all.
In other words, a point which is mathematically near may be practically very far away, perhaps inaccessible.
More generally, the structure of the space I experience and live through follows the ‘lines of force’ of my concrete life situation.
The outstanding property of mathematical space is its homogeneity. No point and no direction is preferred to another; through a simple transformation one can make every point the coordinating zero point and every direction the coordinating axis.
In lived-space these rules are not valid. In it there is both a distinct coordinating zero point which depends upon the place of the living man in space and a distinct axis system which is connected with the human body: above and below, fore and aft, right and left … the vertical axis, determined by the direction of gravitation.
The goal of cartography, perhaps of all of human geography, is to articulate a multitude of such spaces, lived by individuals, into a collective image. Usually, the topographical model of the Earth globe is used to do so, but sometimes, time, or other kinds of efforts necessary to move through space, is better expressed in the form of a network.
The network and the globe are both mathematical spaces, but GéoRécits gives you the possibility to see both at the same time. It facilitates the understanding of a common lived space.
Further reading
- Bollnow, O. F. (1961). Lived-Space. Philosophy Today, 5(1), 31–39.
- Fuhrer, U., & Kaiser, F. G. (1994). Multilokales Wohnen : psychologische Aspekte der Freizeitmobilität (1. Aufl.). Bern [u.a.]: Huber.
- Hägerstrand, T. (1970). What about people in Regional Science? Papers of the Regional Science Association, 24(1), 6‑21.
- Ourednik, A. (2012). Mapping the diachronic reality of the inhabited space on 2D. Revue électronique des sciences humaines et sociales. Consulté à l’adresse.
- Ourednik, A. (2010). Cartografare in due dimensioni la realtà diacronica dello spazio abitato. In E. Casti & J. Lévy (Éd.), Le sfide cartografiche. Movimento, partecipazione, rischio (p. 65–77). Bergamo: Universtà degli Studi di Bergamo: il lavoro editoriale.
- Ourednik, A. (2010). L’habitant et la cohabitation dans les modèles de l’espace habité (PhD). EPFL, Lausanne.
-
SCALAB (équipe). (2004). Échelles de l’habiter. Paris: Contrat de recherche avec le PUCA.