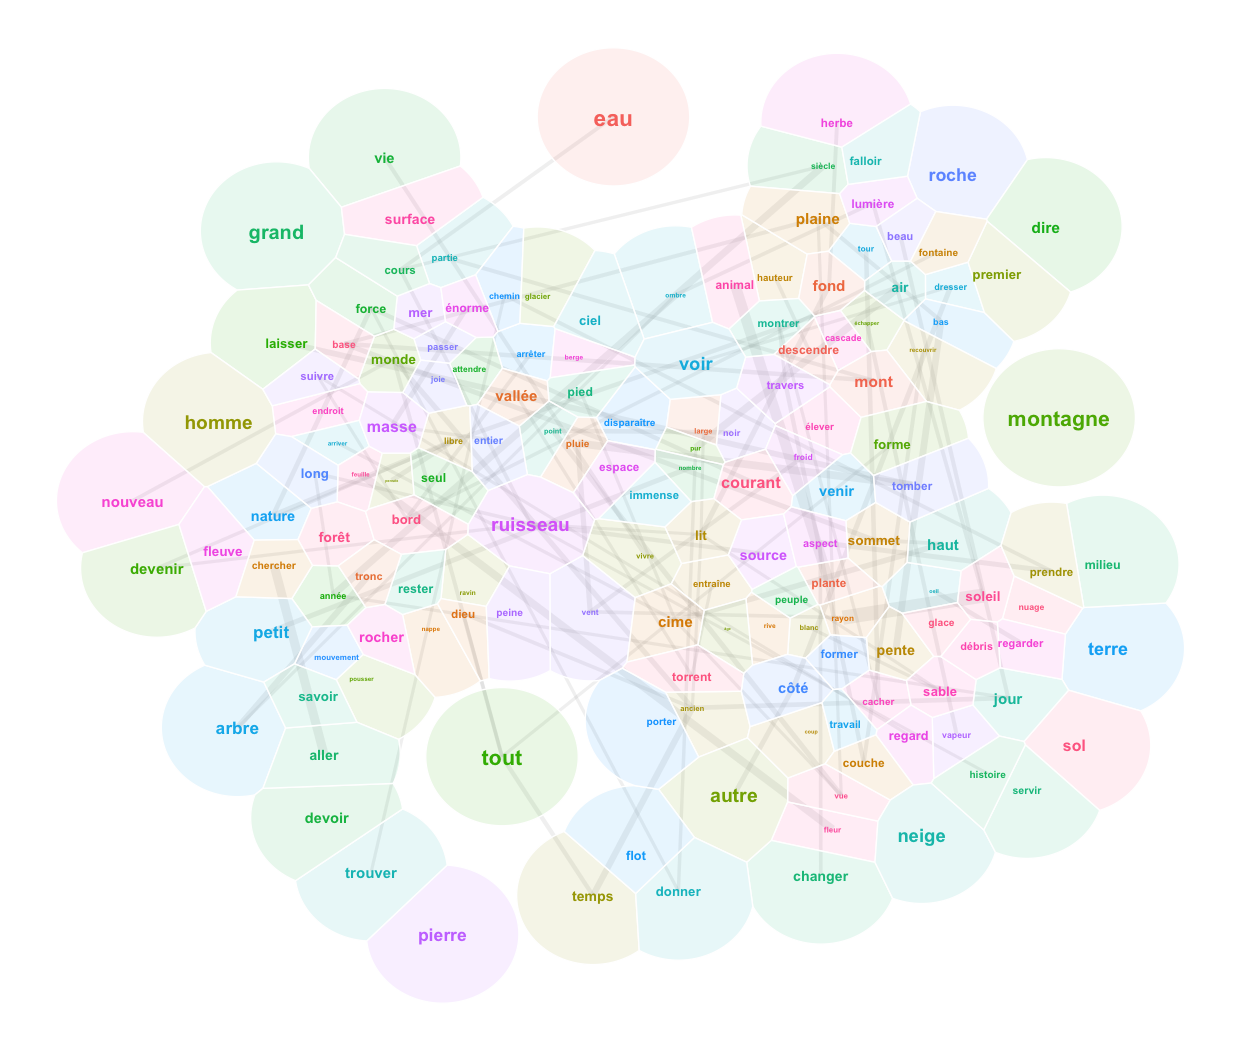
You will find no realistic landscapes prior to the Renaissance. The saints of medieval murals float in a conceptual space informed by hierarchies and symbolic relations; so do those of the Prajñāpāramitā Sūtras. The word “landscape” appears with the Dutch painters of the 15th century. A landscape is a part of the world perceived by […]
Tag Archives: ggplot
Reorder geom_bar or anything else in ggplot by the value of your choosing
You still find recent answers on StackOverflow counseling to redefine the factors of a data.frame to reorder elements of a ggplot graphic. In the 2020’s, this can be avoided. Factors are a heritage of a numerical focus of R, when text values were seen as an anomaly or, at best, as ordinal values. I highly […]
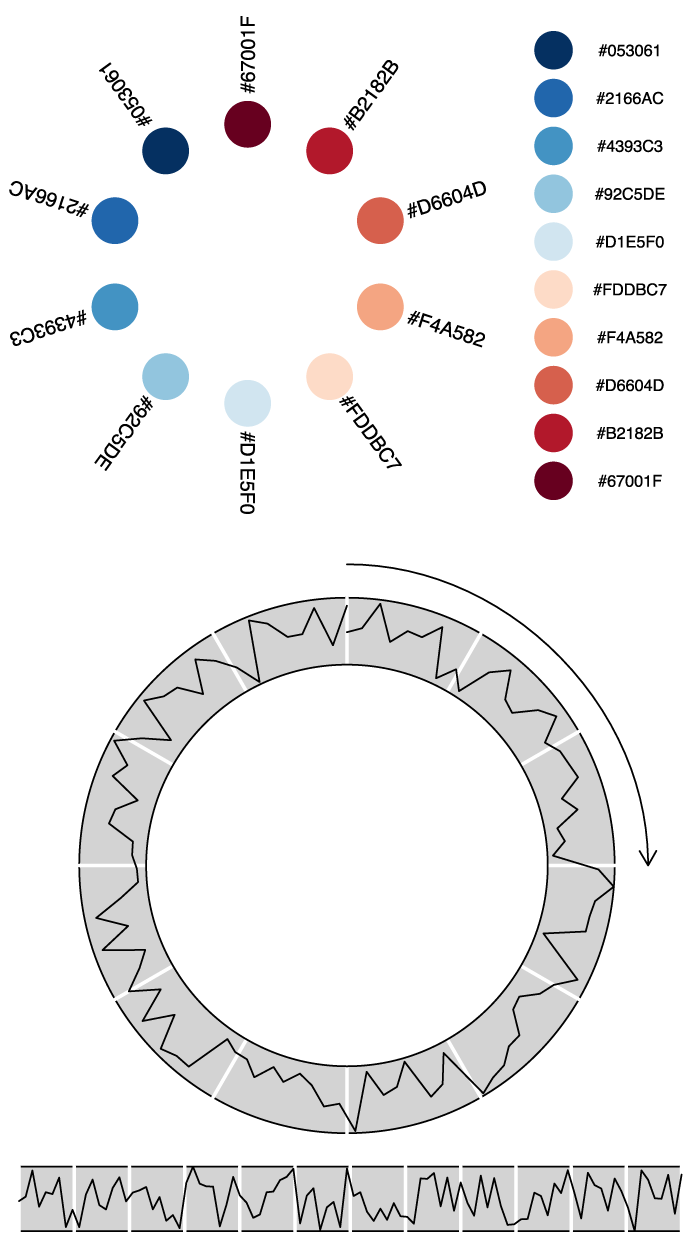
Draw anything you want with R on the Cartesian grid
Most of the graphics documenation in R is dedicated to high level plotting packages that sometimes remind me of LaTeX: you spend less time producing graphical elements you need than getting rid of elements you have not asked for. Some of these packages are great, of course, and you should definitely use them for well […]
Premiers pas avec R et RStudio
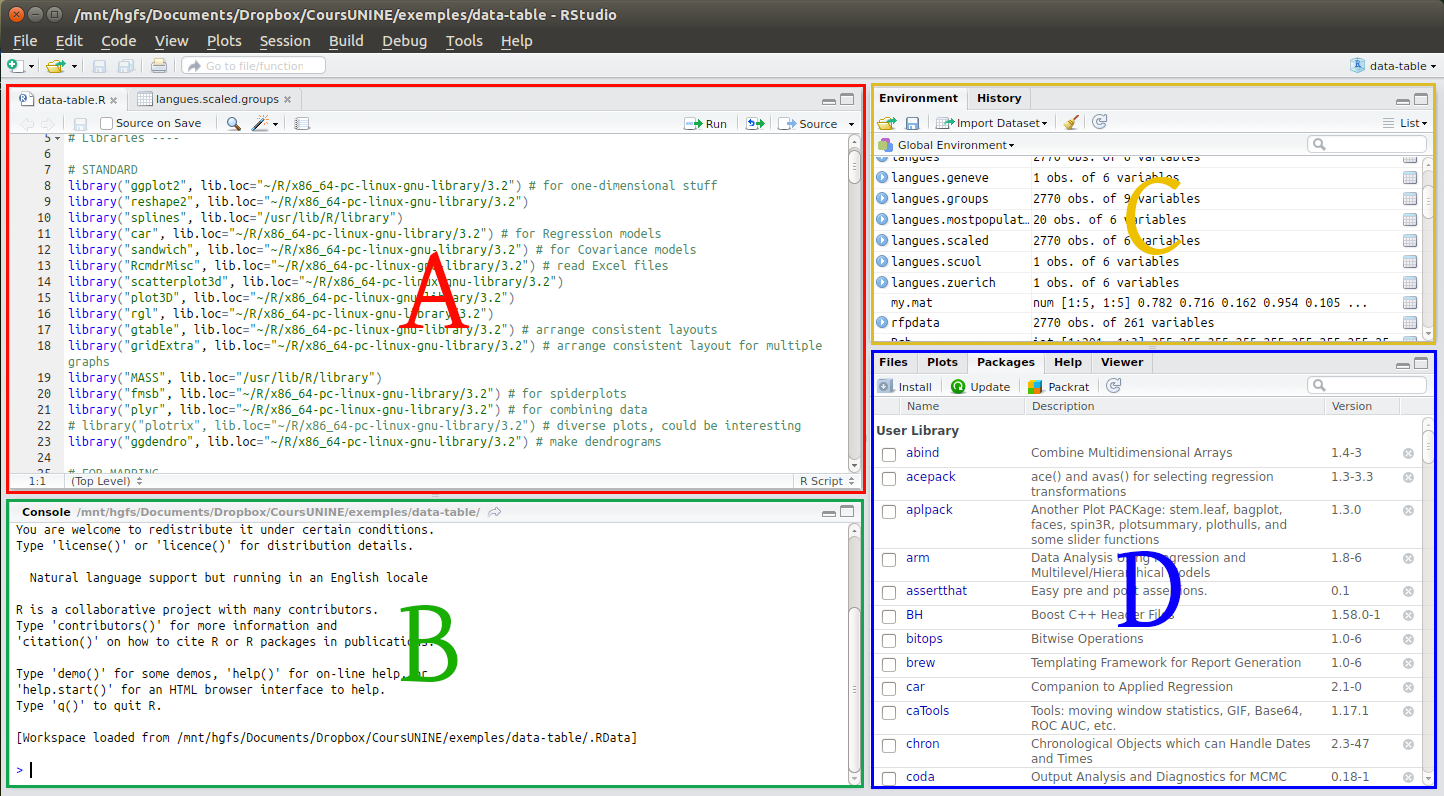
Cet exercice a pour préalable d’avoir installé R et RStudio. Se familiariser avec l’interface Ouvrez RStudio. Vous devriez voir l’interface comme à l’image ci-dessous, pour l’heure sans la partie A. La partie C est en principe vide: Les fonctions de ces différentes parties sont les suivantes: Exécutez des lignes de codes dans la console (B) […]
Stacked histogram with bivariate colored bars in R
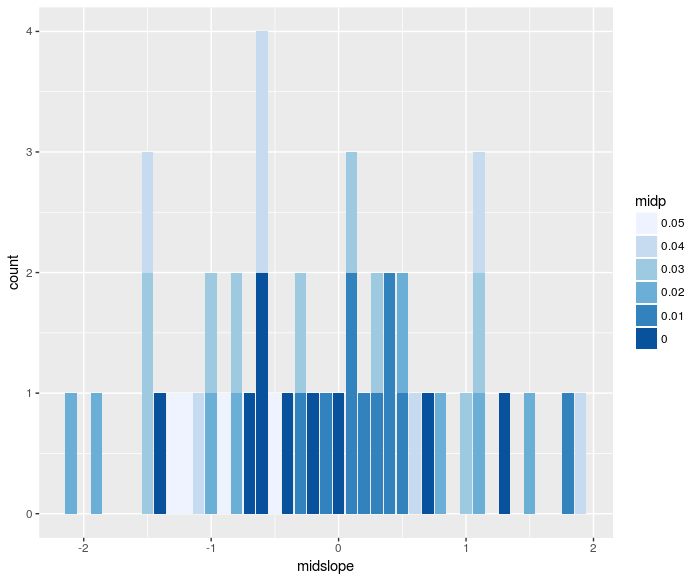
A histogram gives you counts of elements within spefic ranges of a variable, represented as bars. Sometimes, you want to see more than bars. The following code allows you to represent a second variable with a color shade:


