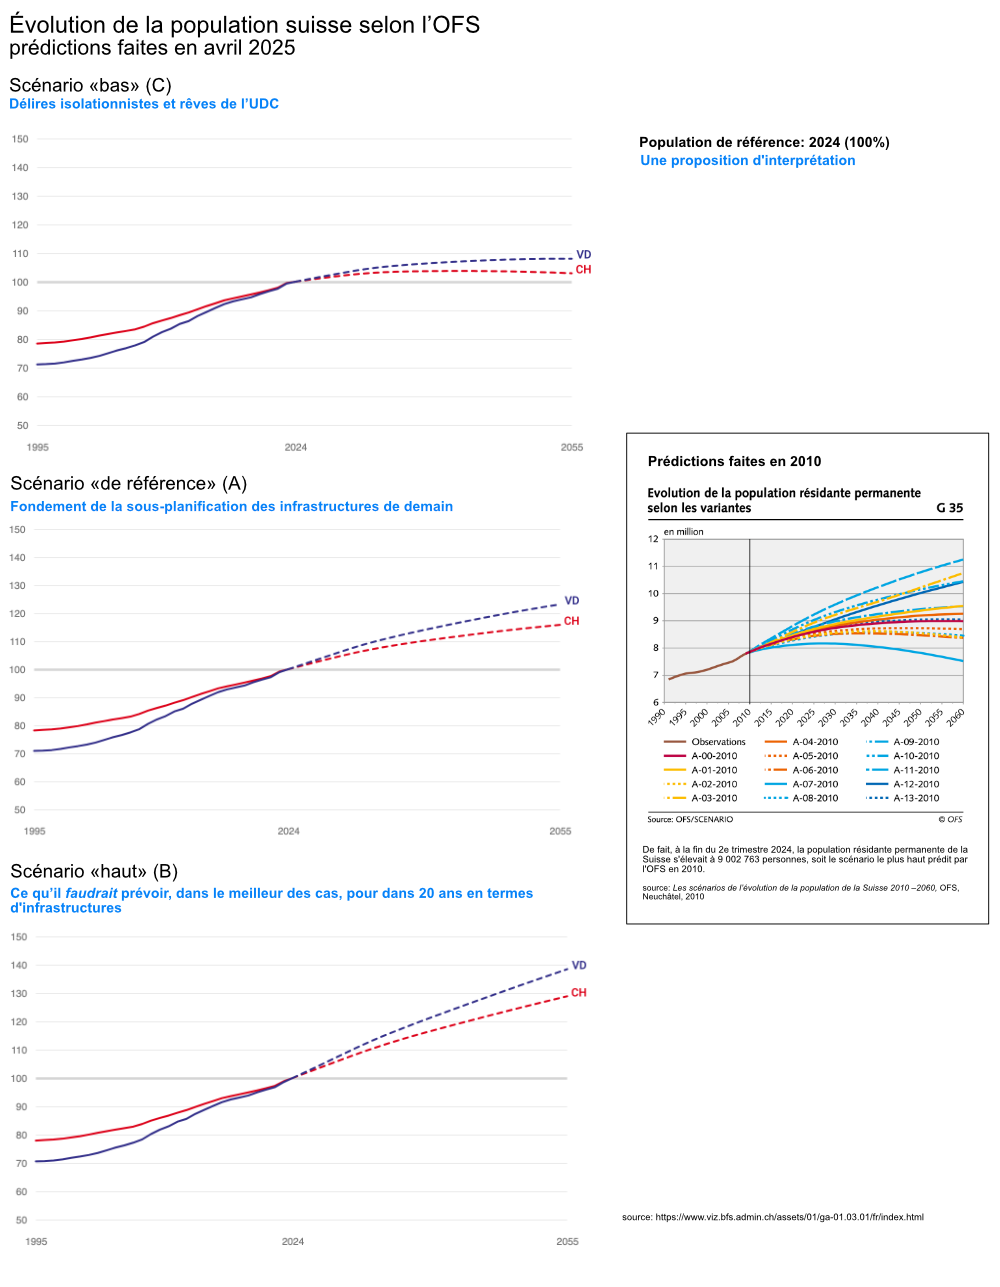
L’Office fédéral de la statistique (OFS) vient de publier ses nouveaux scénarios de l’évolution démographique. Ils me rappellent ceux que j’ai vus lorsque je finissais ma thèse de doctorat en géographie en 2010. À l’époque, j’étais déjà surpris d’entendre l’office nous dire que “la croissance démographique continuera telle quelle, ou alors elle s’arrêtera, ou alors elle va s’accélérer” : […] Continue Reading…
Topic Modeling: la modélisation thématique avec R, Quanteda… et ChatGPT

Ce tutoriel présuppose que vous avez fait vos premiers pas avec le module R Quanteda et que vous maîtrisez les notions stemming, stopwords, matrice document-terme, etc. On part du principe que vous avez installé et activé les modules quanteda, quanteda.textstats, quanteda.textplots, readtext, seededlda et magrittr.
Créez un corpus de textes à partir de données existantes
Idéalement, vous avez déjà un ensemble […] Continue Reading…
Winding Paths in the Space of Conflicts

I rarely travel by plane but, when I do, I can’t help checking that little screen of bad LEDs at least five times an hour, to see the map of locations miles below. Many of them I’ve never heard of, and most of them I’ll never see. Their names appear on the screen like as many alchemic ingredients: Athens, […] Continue Reading…
La numérisation vectorielle de géodonnées avec GeoJSON.io et QGIS
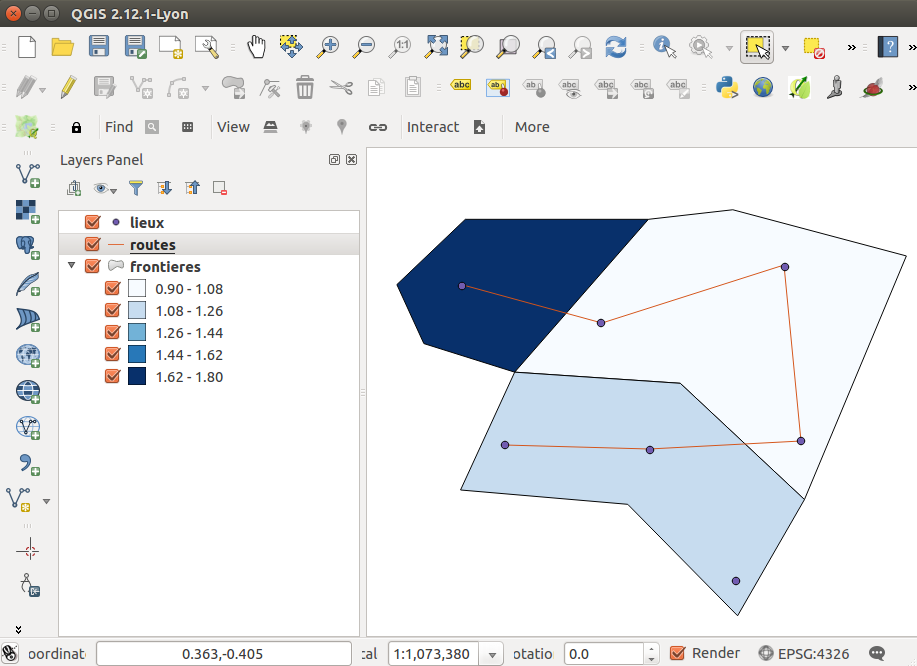
Ce tutoriel vous permet de découvrir des outils de base pour la numérisation vectorielle d’un espace géoréférencé à l’aide de la webapp GeoJSON.io et du logiciel open source Quantum GIS.
Prérequis
Connaître la différence entre le dessin vectoriel et le dessin raster.
Savoir que les objets de base du dessin vectoriel sont le point, la ligne et la surface.
Savoir ce qu’est […] Continue Reading…
Division by Zero – Sometimes Usefull

“Zeroworld”, a recent episode of the WNYC podcast Radiolab, examined the possibility of division by zero. The discussion turned mostly metaphysical and got many listeners so angry that they went on to rant on Reddit. I understood this episode more as a fun thought experiment than as a formal proposal. But it also reminded me of some of […] Continue Reading…
Correctly sort Bibliographic Entries with Diacritics in LaTeX (natbib, BibTeX)
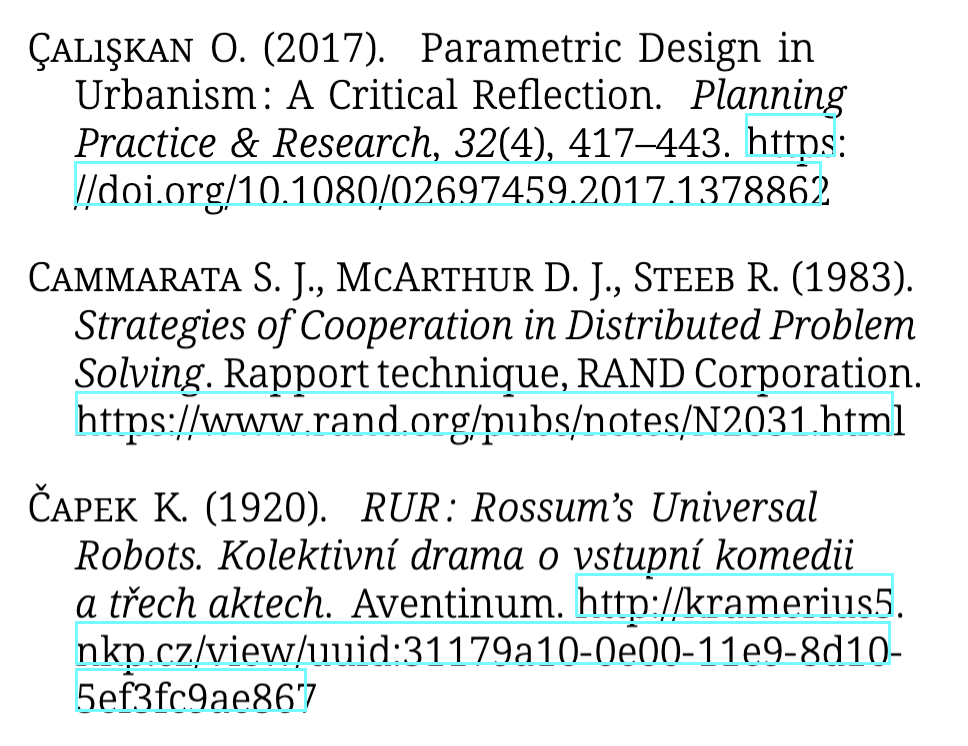
LaTeX started as an ASCII thing for English speaking nerds. Only later did people start to use it all over the word, in many languages from Cezch to Hindi. We now have XeTeX and LuaLaTeX. But like the serpent Sesha in the Hindu mythology, some of that early ASCII universe remains, notably in the BibTex part of things.
BibTeX […] Continue Reading…
Climate Change Time Series Visualization with Polar Coordinates in R
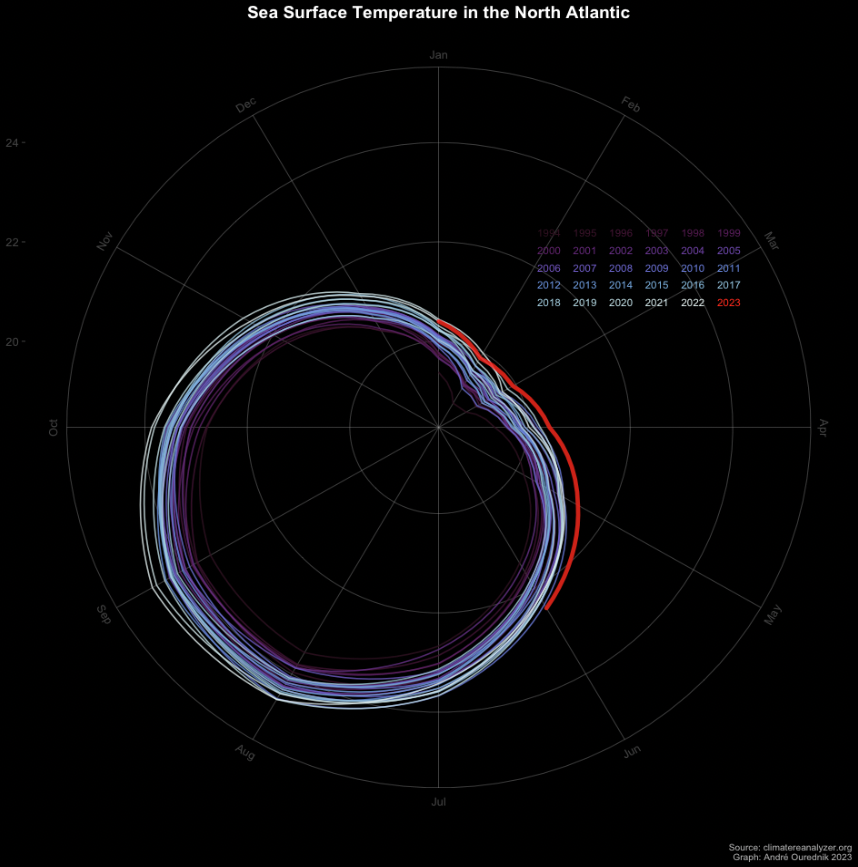
This graphic appeared in social media lot in the last days
I wondered how it would render on polar coordinates. So I made an R script to do so. The script is reusable for other data sources as I show below. So reuse, enjoy, and make useful.
The plotting function
seasonplot <- function(tsdata,maintitle,source,legxleft,legxrigth,legytop,legybottom) {
# drawing paremeters
[…] Continue Reading…
Analyse de séries temporelles avec R
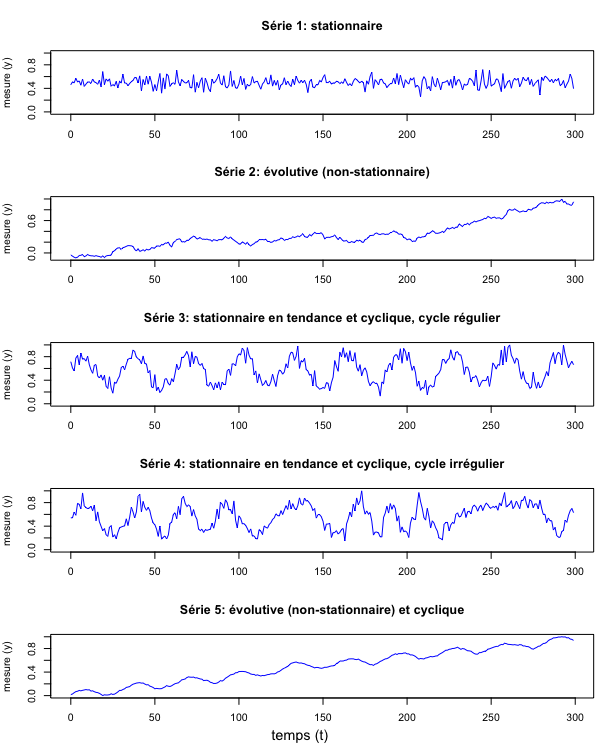
Une “série temporelle” est une suite d’enregistrements d’une variable faits au cours du temps. Cette variable peut être la température, la fréquence d’accidents routiers ou l’amplitude du son enregistré par un microphone. Les mesures peuvent être prises à des intervalles réguliers ou pas.
Pour avoir une base de discussion, préparons d’abord quelques données fictives. Ne vous inquiétez pas si […] Continue Reading…
Figures and Maps of Concepts

This blog entry is work in progress… Please be patient, more content is comming soon. Meanwhile, you can read other posts.
Concepts are encoded in most artworks, at least in all that make it to the museum and visiotors bother to see and acedmics to write about. I focus here on major examples.
Psyche and knowledge
Sigmund Freud
The ego (Ich), the […] Continue Reading…
Cartographie et géomatique avec R (2024)
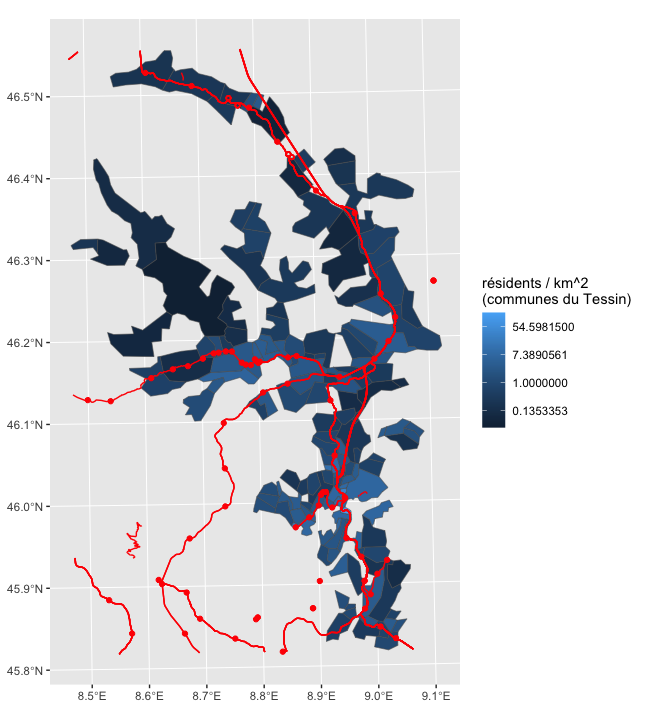
Deux modules R principaux servent aujourd’hui pour le traitement de données géomatiques:
le module sf (simple features) dédié aux géodonnées de type vecteur, qui rassemble les développements antérieurs réalisés notamment dans les modules sp, rgdal et rgeos. Sa documentation est très complète et conviviale.
Le module terra, dédié aux géodonnées de type vecteur et raster. Terra offre donc un […] Continue Reading…