You still find recent answers on StackOverflow counseling to redefine the factors of a data.frame to reorder elements of a ggplot graphic. In the 2020’s, this can be avoided. Factors are a heritage of a numerical focus of R, when text values were seen as an anomaly or, at best, as ordinal values. I highly […]
Tag Archives: rstats
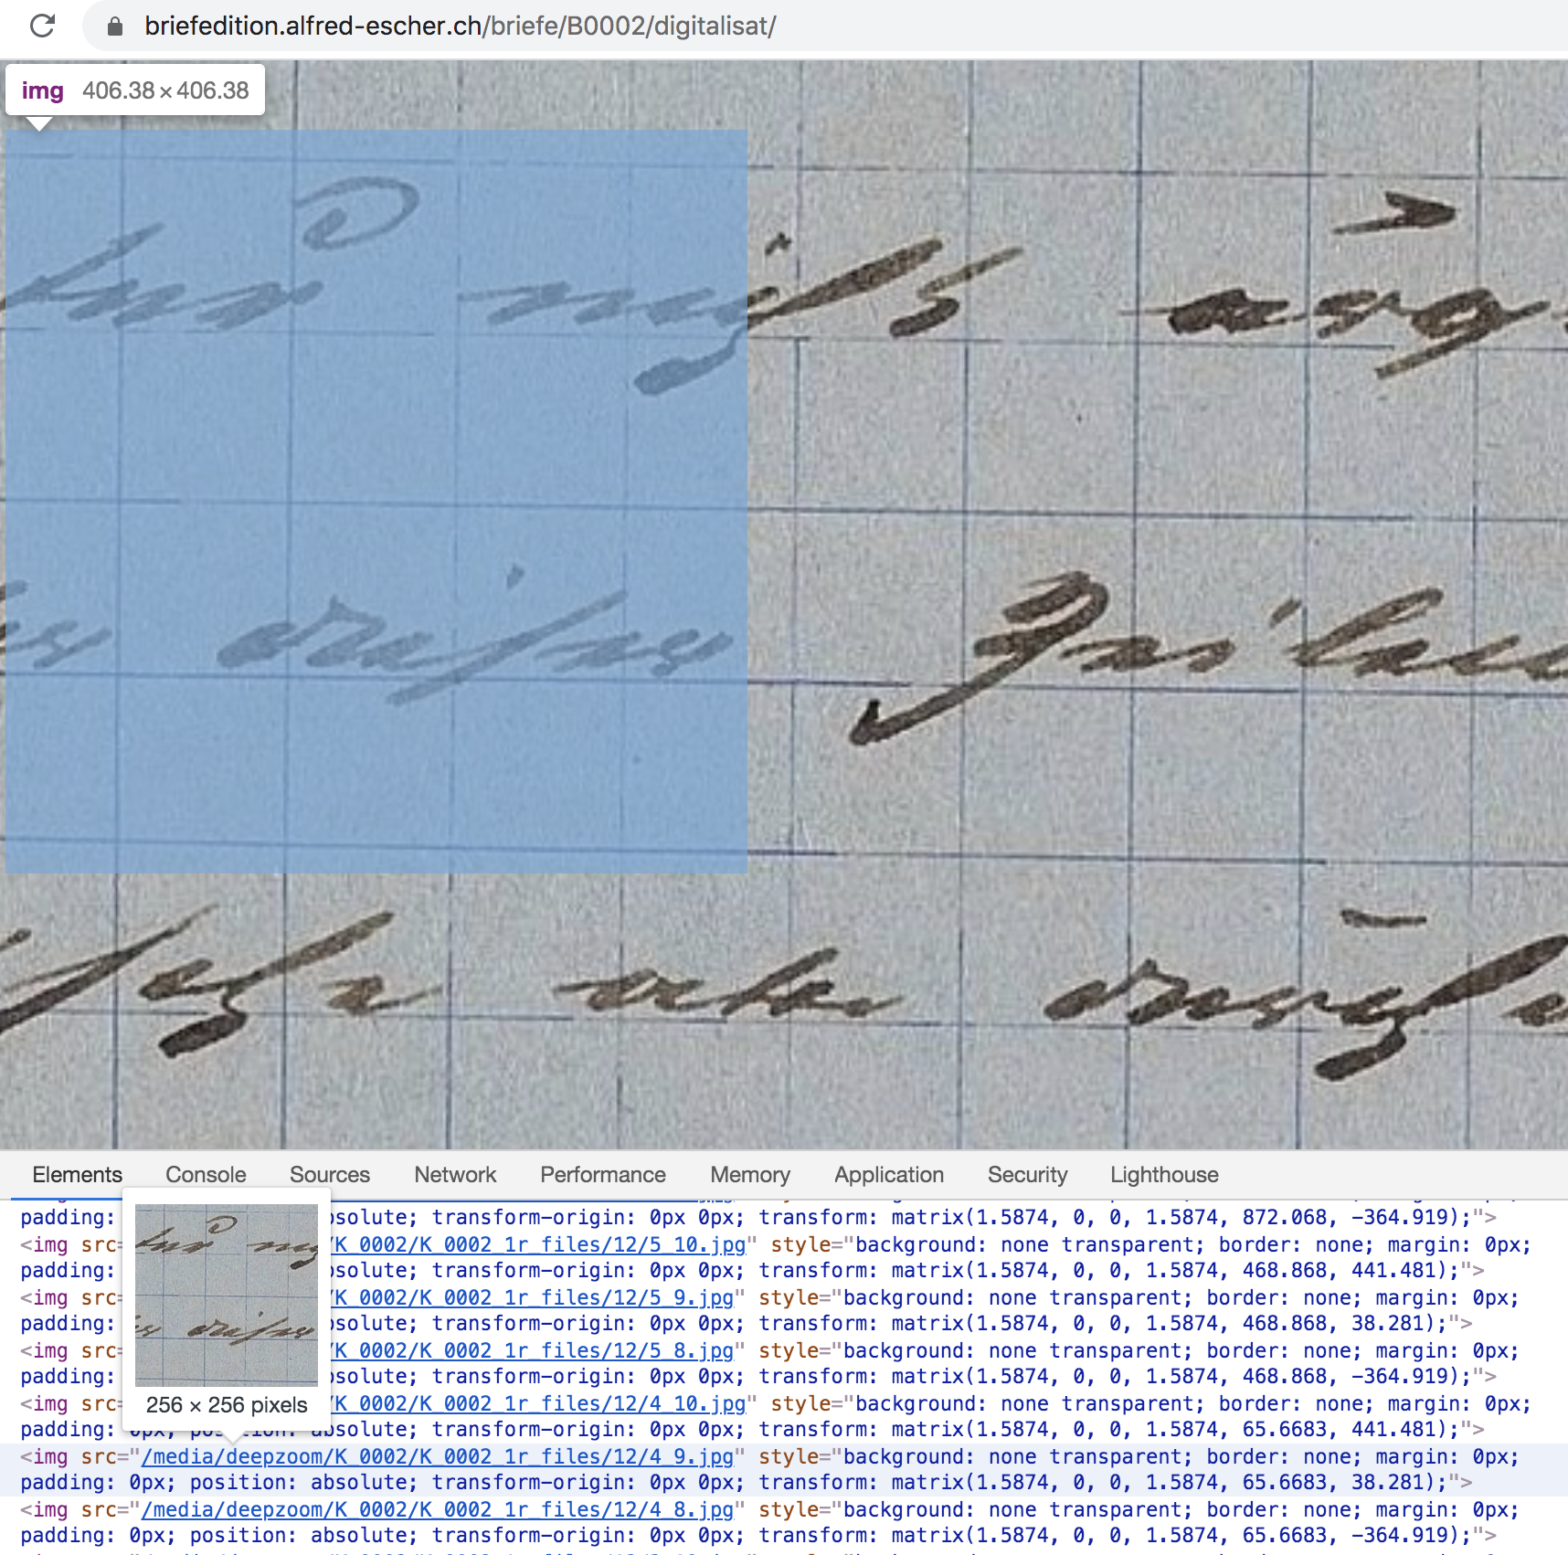
Scrape an image from DeepZoom with R and magick, recomposing a single image from multiple tiles
DeepZoom allows webmasters to display high resolution images in an online viewer. Among its users: The British Library The World Digital Library (WDL) Polona, the Polish Digital National Library BALaT, Belgian Art Links and Tools and many others DeepZoom mostly discourages downlading the original high resolution images to your local drive. This is how to […]
Workshop Poliphilo 2: seconde partie
Ceci est la seconde édition du workshop créé par l’auteur pour le laboratoire d’architecture ALICE (EPFL-ENAC) dans le cadre du projet de recherche et d’enseignement POLIPHILO. Le premier workshop (2019) demeure disponible en ligne. Si vous n’avez pas assisté à la séance du 1e avril, consultez la première partie du deuxième workshop. Dans cette seconde […]
Workshop Poliphilo 2 : première partie
Ceci est la seconde édition du workshop créé par l’auteur pour le laboratoire d’architecture ALICE (EPFL-ENAC) dans le cadre du projet de recherche et d’enseignement POLIPHILO. Le premier workshop demeure disponible en ligne. Première partie Dans cette première partie, nous allons étudier les diverses relations spatiales entre les lieux. Vos données Pour la suite de […]
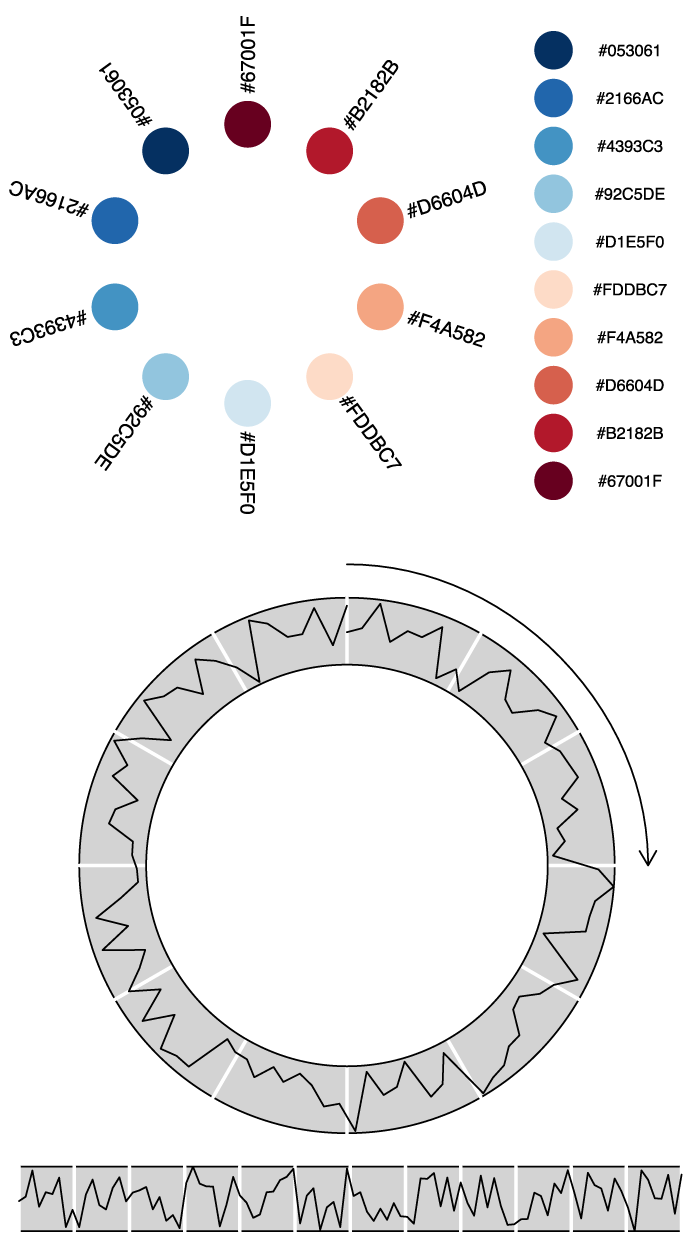
Draw anything you want with R on the Cartesian grid
Most of the graphics documenation in R is dedicated to high level plotting packages that sometimes remind me of LaTeX: you spend less time producing graphical elements you need than getting rid of elements you have not asked for. Some of these packages are great, of course, and you should definitely use them for well […]
Repair a pandoc-generated LaTeX table with R
Pandoc is a great piece of software but it is not always kind to HTML tables when converting to LaTeX. Especially tables containing <tr> elements with rowspan or <td> elements with colspan attributes end up as sequences of lines of text, not embedded in a table environment like longtableand devoid of both line endings (\\) […]
Text Mining: Detect Strings: Very Fast Word Lookup in a Large Dictionary in R with data.table and matrixStats
Looking up words in dictionaries is the alpha and omega of text mining. I am, for instance interested to know whether a given word from a large dictionary (>100k words) occurs in a sentence or not, for a list of over 1M sentences. The best take at this task is using the Julia language, but […]
Premiers pas avec R et RStudio
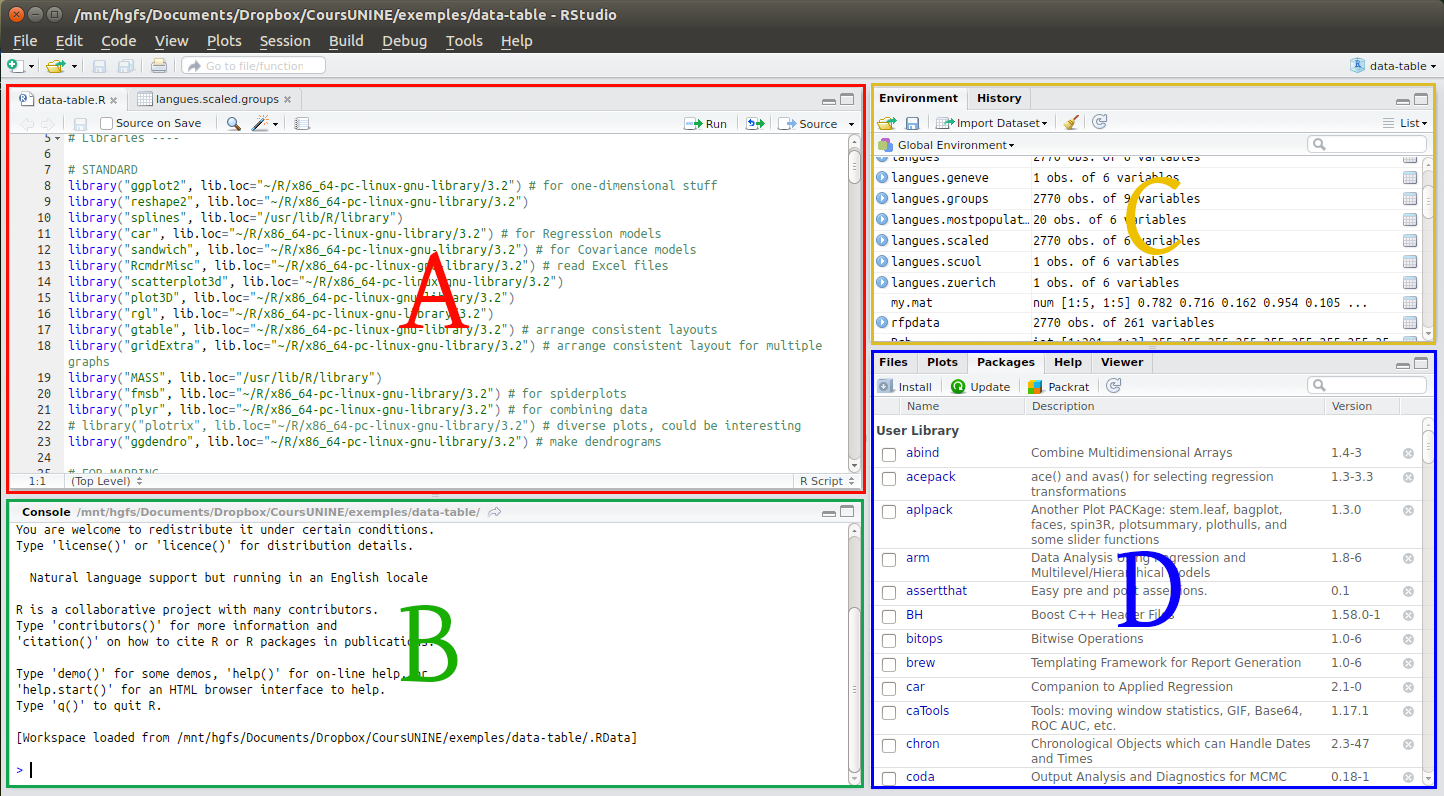
Cet exercice a pour préalable d’avoir installé R et RStudio. Se familiariser avec l’interface Ouvrez RStudio. Vous devriez voir l’interface comme à l’image ci-dessous, pour l’heure sans la partie A. La partie C est en principe vide: Les fonctions de ces différentes parties sont les suivantes: Exécutez des lignes de codes dans la console (B) […]
Installer R et RStudio comme logiciels indépendants
R est un langage de programmation. Pour que les programmes écrits en R fonctionnent, il est nécessaire d’installer au préalable un environnement d’exécution pour ce langage. RStudio est un environnement de développement (en anglais: IDE: Integrated development environment) pour R. Installer l’environnement d’exécution du langage de programmation R Vous pouvez installer R et RStudio comme […]
Installer Orange Data Mining avec Miniconda
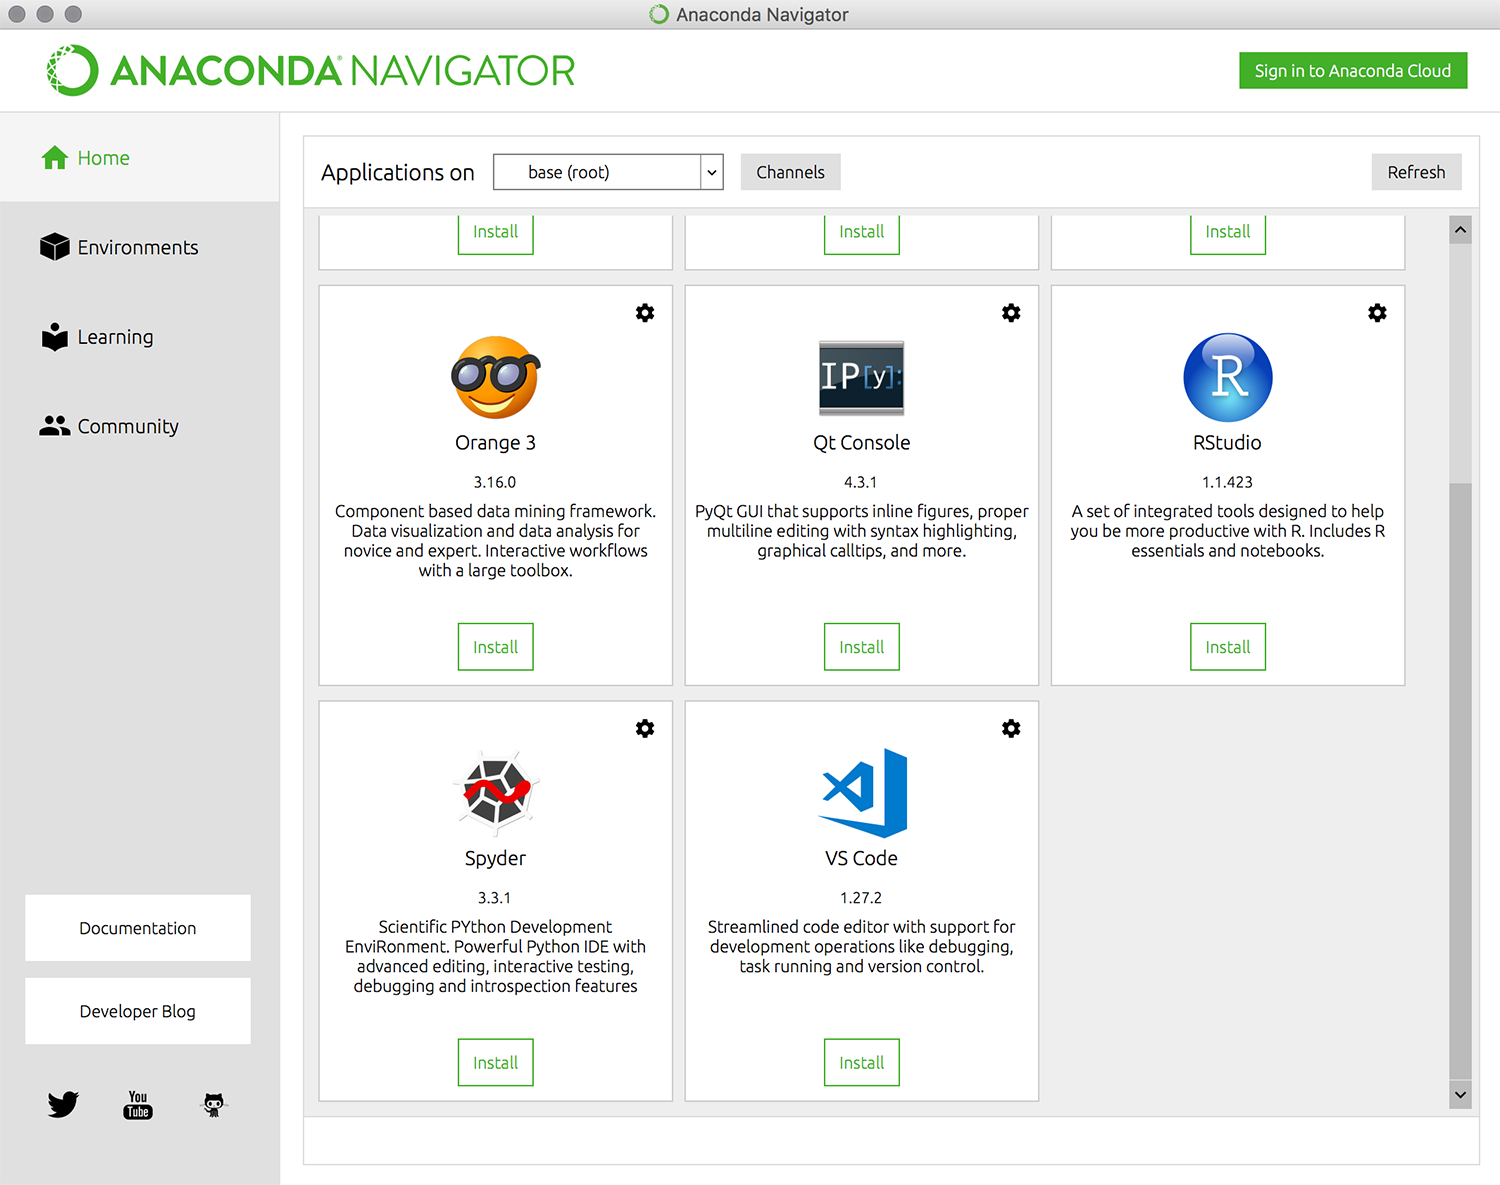
Installer Miniconda Conda est disponible en deux versions : Miniconda et Anaconda. Miniconda n’inclut que les modules essentiels au premier téléchargement. Anaconda est plus complet et vous évite peut-être des téléchargements ultérieurs, mais pèse 4Go sur votre disque dur… Pour macOS Suivre les instructions sur https://conda.io/docs/user-guide/install/macos.html. Vous pouvez ignorer la partie consacrée à l’installation silencieuse […]


