Counting how many people reside at a given address might just not be enough to understand a territory of mobile individuals. Instead of counting people, I count their “stay-times”. In other words, I sum up the time spent by people in each place.
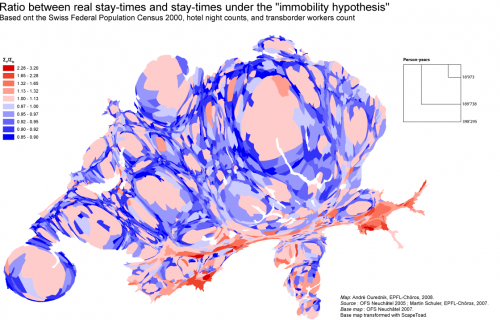
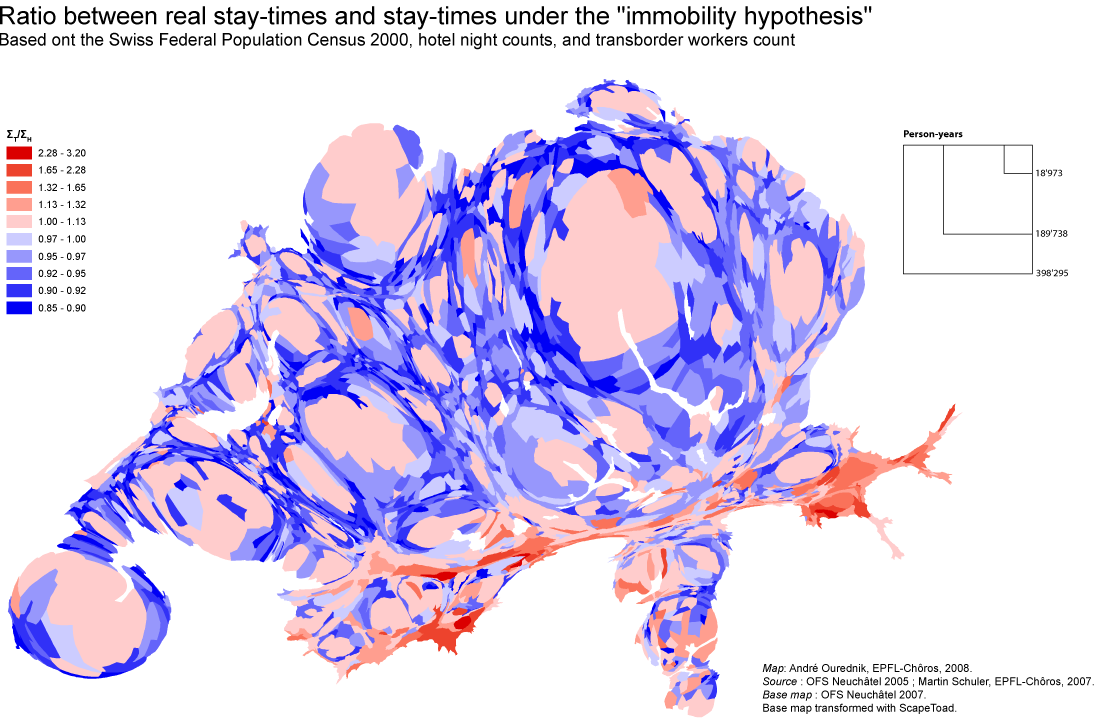
The map above compares two results:
- ΣH, the hypothetical total stay-time which would have been registered if people never moved.
- ΣT, the observed total stay-time, calculated from data of the Swiss Federal Population Census 2000, the hotel night counts and the transborder workers counts.
Both ΣH and ΣT are calculated in minutes. If ΣH of a commune is divided by the number of minutes within a year, we get the residential population of that commune.
The ratio ΣT/ΣH makes it possible to identify communes whose “population” is under- or over-estimated by standard census counts. They also make it possible to identify attractors of mobility. In effect, red areas have a larger population than suggested by a residents-count, because time is spent in them by people residing in other communes. Blue areas, on the contrary, have a smaller population.
The lowest ΣT/ΣH-ratios are registered for peri-urban communes. Obviously, people who sleep in these actually live elsewhere.
The highest ΣT/ΣH-ratios are registered in the cantons of Valais and Graubünden mountain resorts. In most extreme cases, tourists triple their population. Urban centers have “only” up to 30% more dwellers then resident-counts would suggest, but their ΣT/ΣH-ratios are systematically positive.
These population differences are important for many reasons, among which infrastructure costs. Shouldn’t peri-urban regions contribute more to the financing of urban centers?
Spatial data resolution: Swiss commune.
Time-data resolution: minutes.
Data handling tools: SPSS and Excel.
Mapping tools: ArcMap, ScapeToad (for the anamorphosis) and Illustrator.
