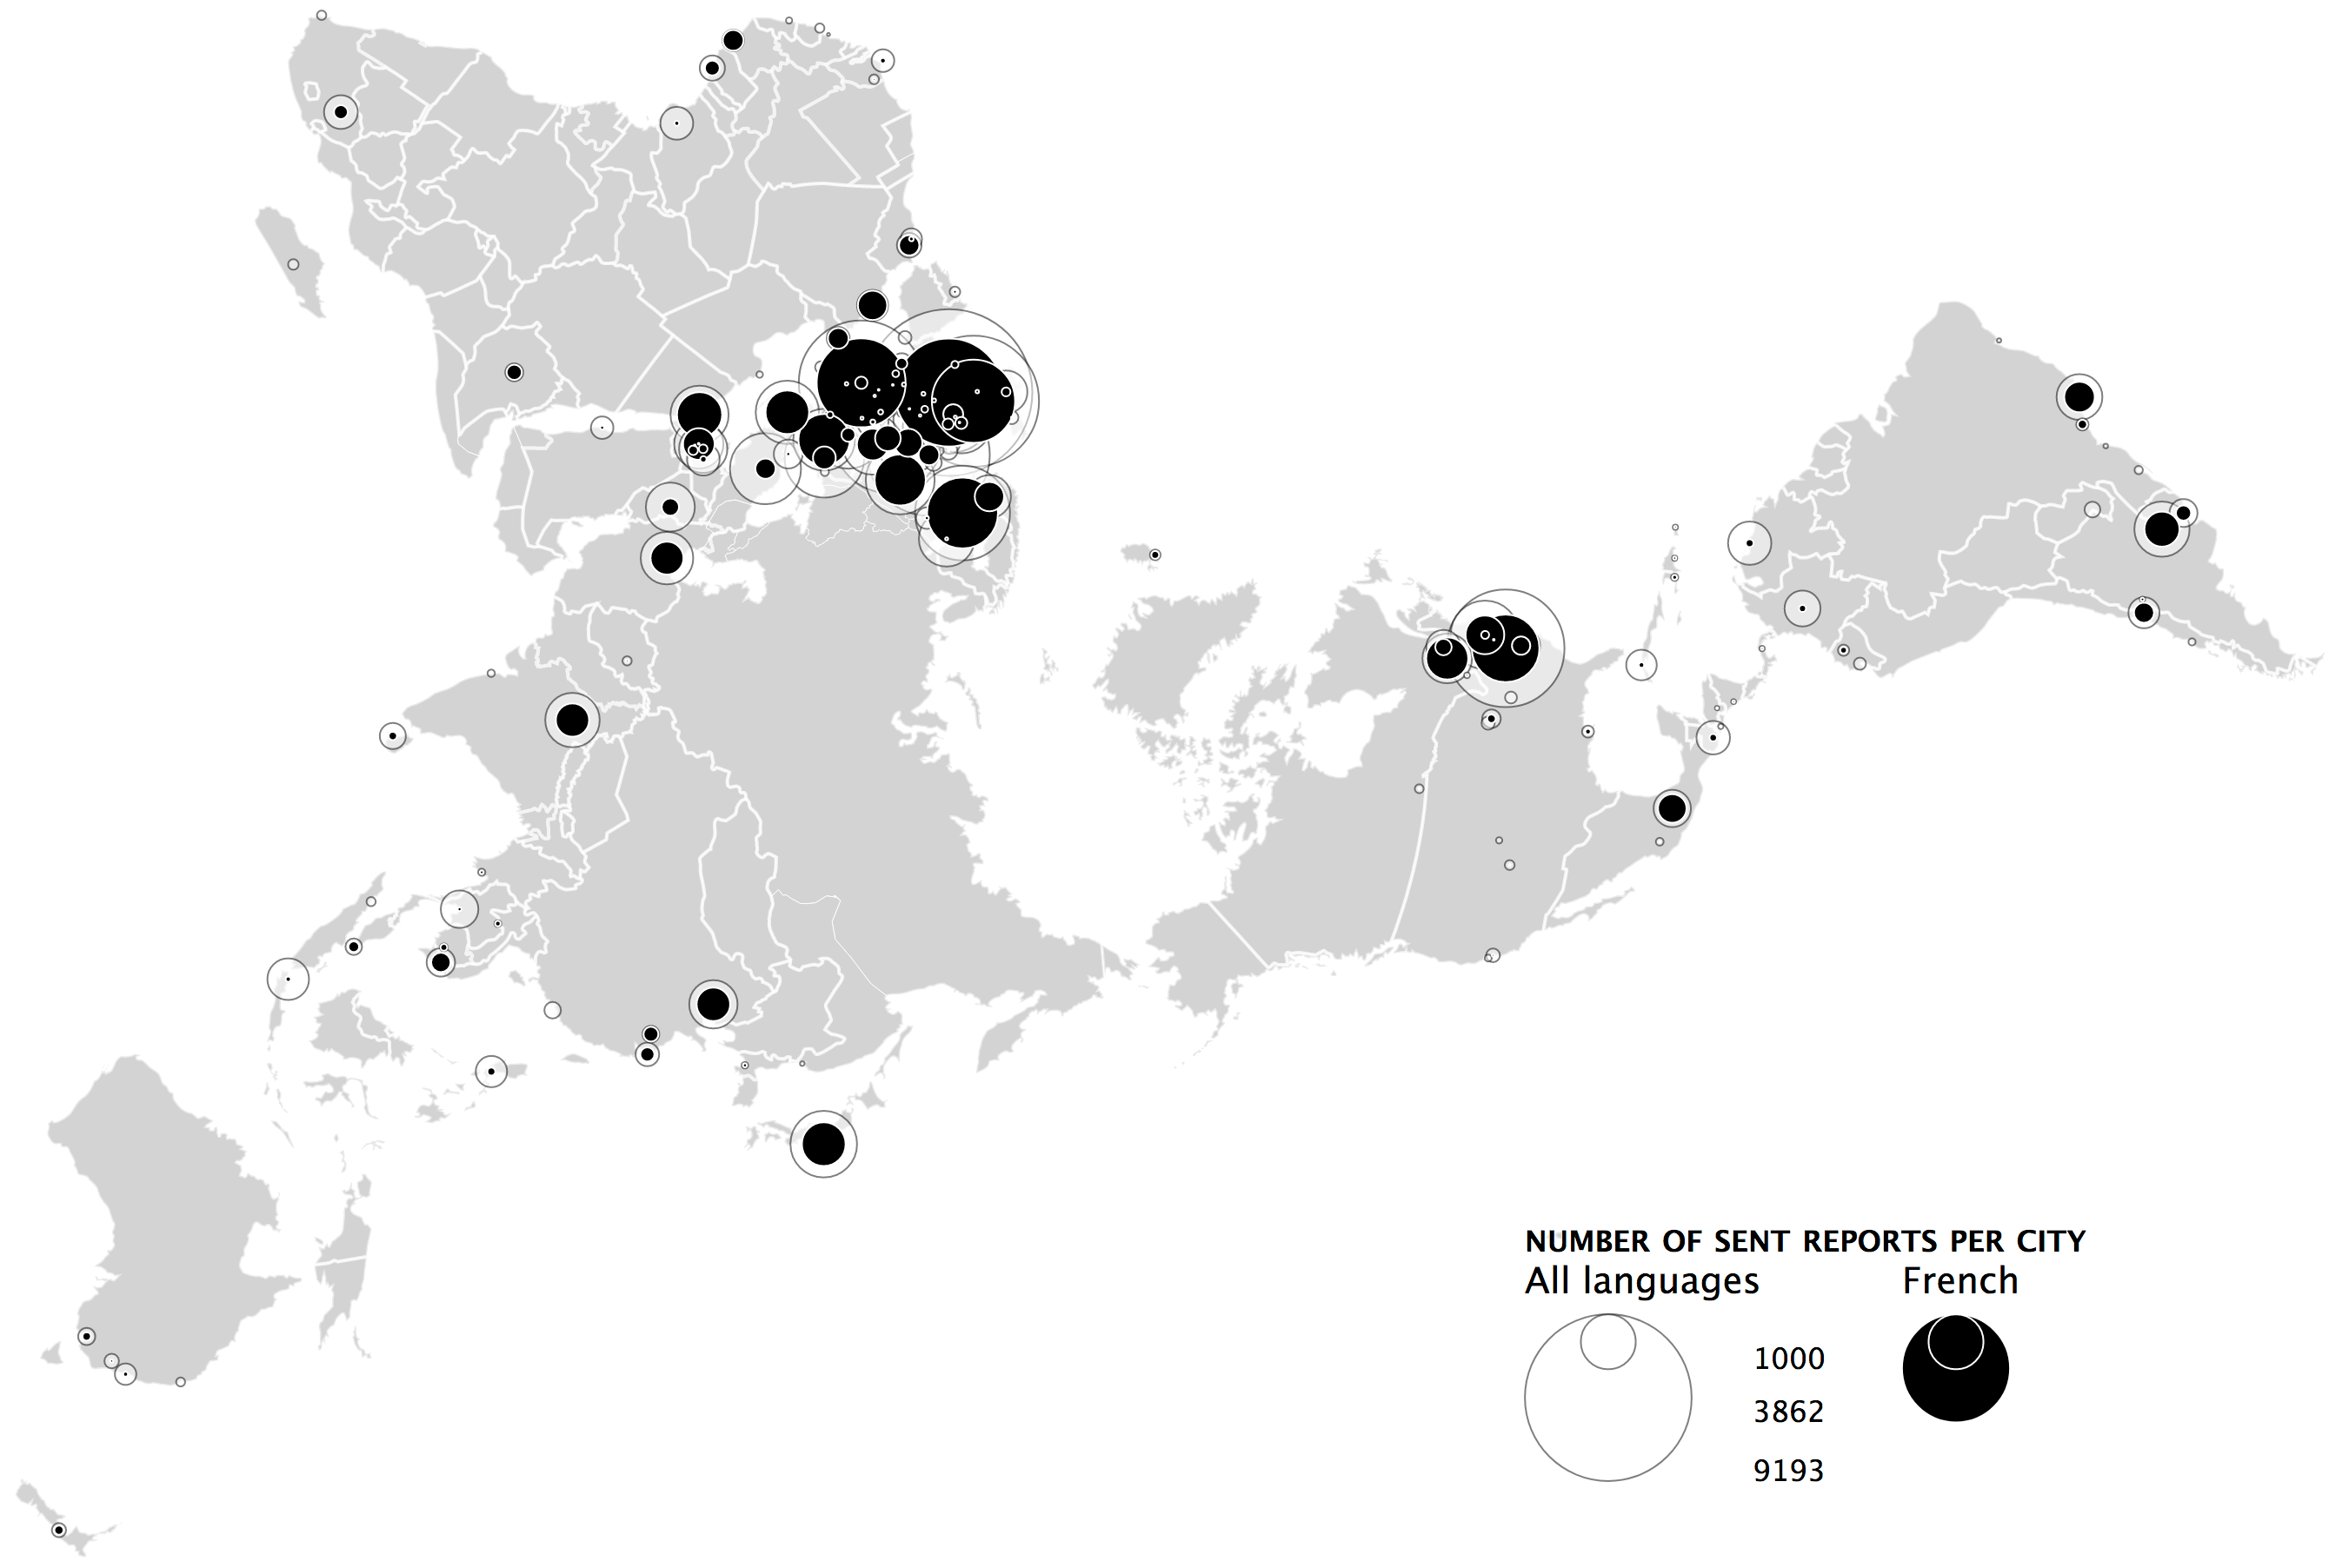
The legend for proportional circles sizes is drawn automatically. Reprojectiong on the fly from WGS84 to the newly available AirOcean (Dymaxion projection) in D3v5. Example data: number of political reports sent by Swiss embasies to Bern in all languages and in French specifically betwee 1920 annd 1960. Basemaps are from here. Running D3 version of […]
Tag Archives: proportional circles
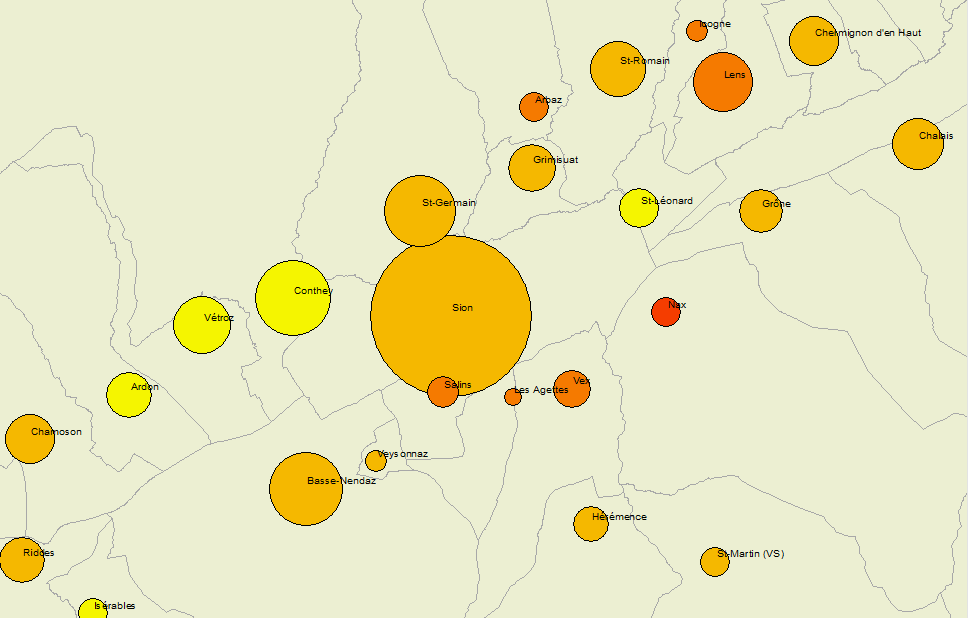
QGIS – visualiser des données en cercles proportionnels
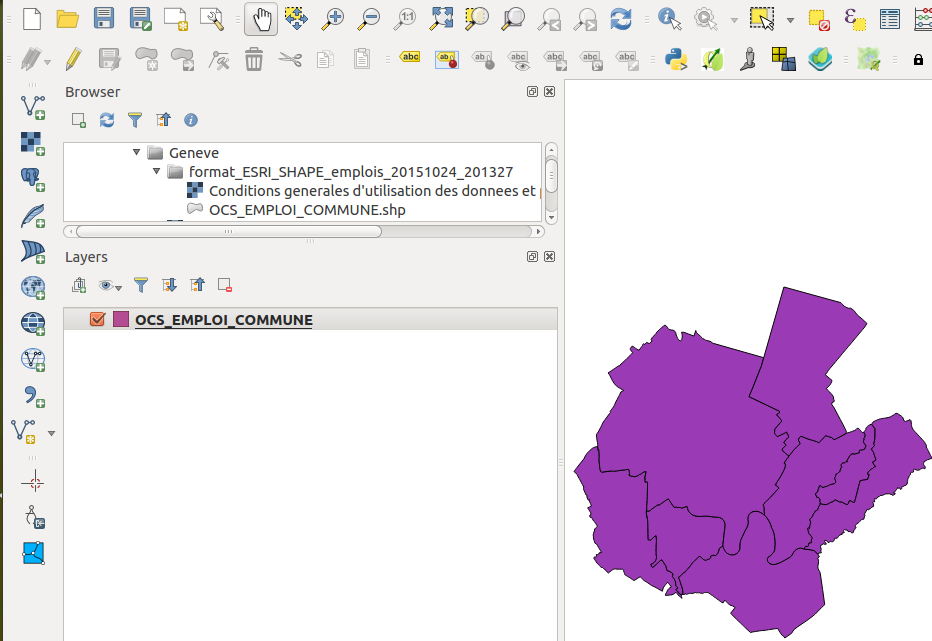
Pour cet exercice, vous avez besoin de téléchargez et d’installer qGIS si ce n’est pas déjà fait. Trouver des données d’exercice Si vous n’avez pas vos propres gédonées, vous pouvez en trouver par exemple sur le portail SIG du canton de Genève, SITG > Cartes à personnaliser. Ou télécharger un autre fichier shape, par exemple […]
Colored proportional circles in ArcMap
Bivariate thematic mapping with ArcMap? Yes you can! Of course, you could also do it in D3.js (including a nice self-generated legend), or with much less effort in Quantum GIS (post in French). Whatever method you choose, colored proportional circles cannot be drawn directly on polygons, but you can draw them on points. Thus, all […]