Retroactive mechanisms of segregation, between an urban society and its space
This is an agent-based model. It shows shows how tax competition between counties or municipalities makes the rich richer and the poor poorer.
How?
This modle combines "Schelling's spatial segregation model" with an inheritance mechanism. Children with many siblings inherit less. (in demographic terms: the fertility rate of a household lowers the economical status of its members). The model starts with a homogeneous population, evenely scattered throughout space. Later on, social differentiation occurs and a spatial segregation pattern emerges. Taxes collected by zone reinfore this tendency. Theey become lower in zones concentrating richer populations.
WHERE DOES THE MODEL COME FROM?
Presented at ThéoQuant 2005, NEW AREAS IN THEORETICAL AND QUANTITATIVE GEOGRAPHY, University of the Fanche-Comté and Bourgogne, Besançon.
Pubished in Revue Internationale de Géomatique, Dynamiques urbaines et mobilités, vol. 17 no.2/2007, pp. 183-206.
MODEL ELEMENTS:
- an euclidian space of (x, y) places representing a urban space.
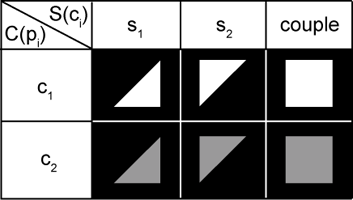
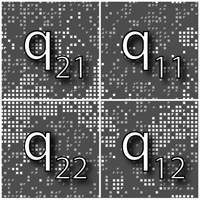
- four districts, Q = {q21,q11, q22, q12}.
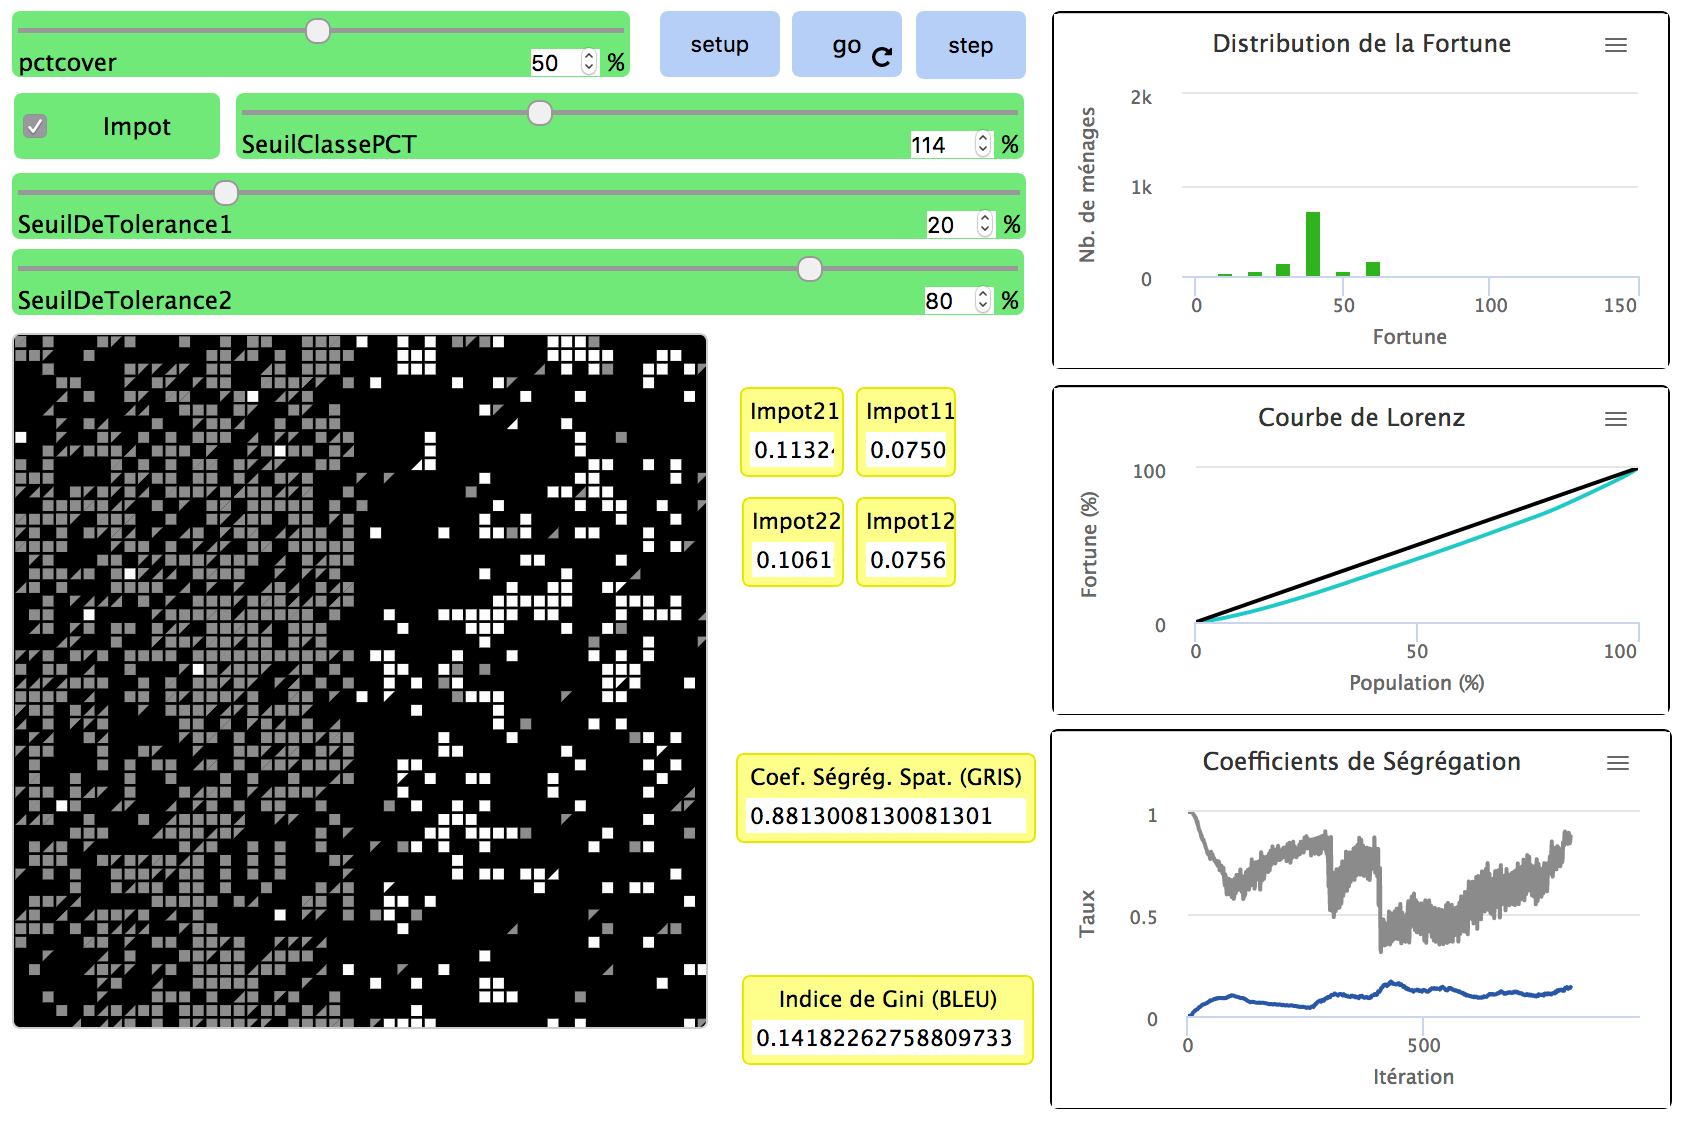
- a population of households, P={p1,p2,...,pn} . The initial number of households can be set with the "PCTCOVER" parameter.
- a neigbourhood, V(pi) ⊂ P, of identical form for every p (always a level-1 Moore neighborhood)
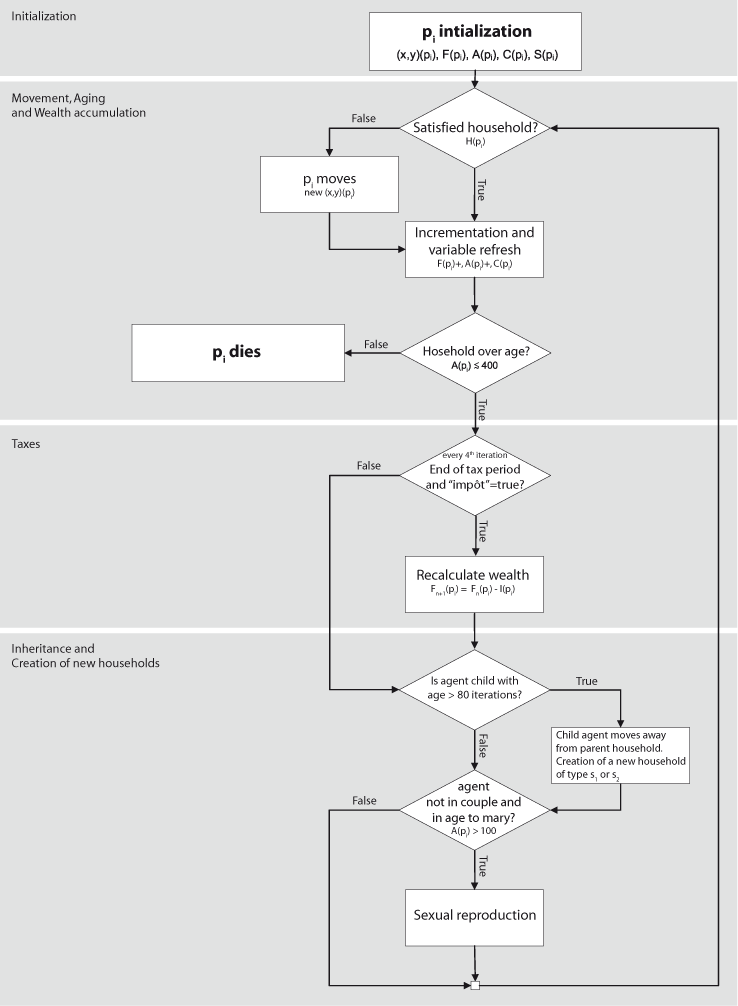
- an age, A(pi) ⊂ [0, 400].
- a "class threshold", K, user-defined in terms of % of the median wealth. Set with the "SEUIL DE CLASSE PCT" parameter.
-
a social class (dependent on household fortune and class threshold):
C(p) = { c1⇔F(p) > K c2⇔F(p) < K - a tolerance threshold, T(ci), representing the highest level of exposure X(pi) a class ci household is ready to tolerate in its neighborhood before leaving. Set by the "SEUIL DE TOLERANCE 1" and "SEUIL DE TOLERANCE 2" parameters.
- a level of exposure X(pi), defined as the ratio between the number of neighbors from a different social class and the total number of neighbors. Formally:
X(pi ) = | { p :( p ∈ V(pi ) ) ∧( C(p) ≠ C(pi ) ) } | | { p : p ∈ V(pi ) } |
- a level of satisfaction H(pi), dependig on the exposure: H(pi)≡( X(pi) < T(ci) ). Unsatisfied households move.
- taxes, I(pi), calculated separately for every district as based on district populations |PQ| and not on the sums of district wealths ΣF(pi ∈ PQ) (thus following the idea of an equal consumption of public resources by every individual). This has for effect a fiscal advantage for districts with high concentrations of superior wealths. Formally:
I(pi) =F(pi) ( Σ{p: Q(p) = Q(pi)} I( Q(pi ) ) F(p)
) where I( Q(pi ) ) = I(Ω) | {p:Q(p) = Q(pi )} |
| P |
and I(Ω) = 0.1 ΣF(p)
System dynamics:
Results:
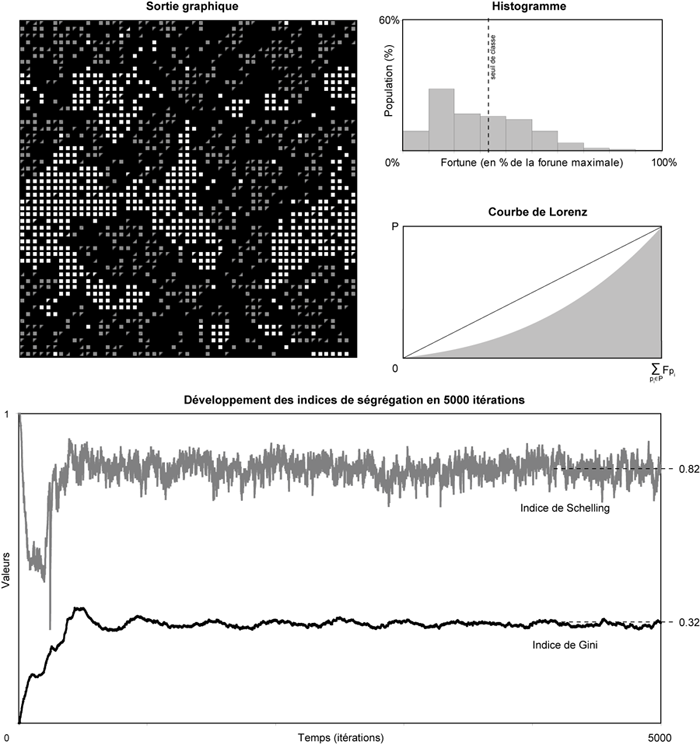
1st simulation — Without taxes: T(c1) = 40%, T(c2) = 70% et K = 110%":
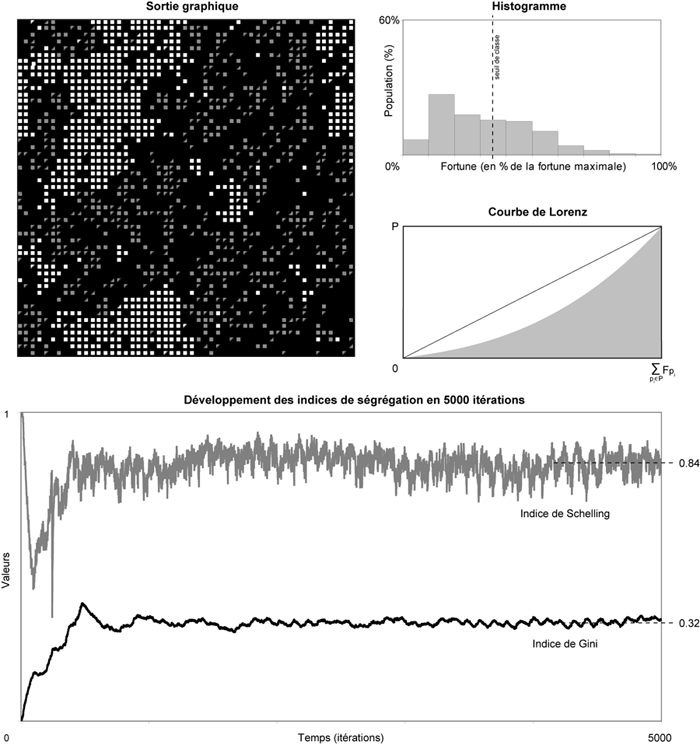
2nd simulation — Without taxes, with T(c1) = 40%, T(c2) = 70% and K = 110% (ie, same paramters as in the 1st simulation):
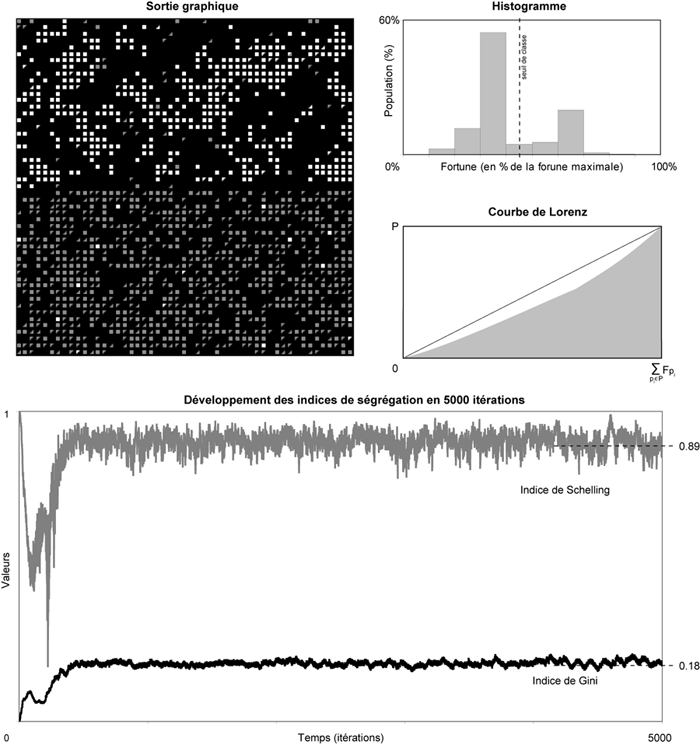
3rd simulation — Same parameters as in Simulation 2 (T(c1) = 40%, T(c2) = 70% et K = 110%), but with activated taxes. The following tax values have been observed: I(q11) = 6.9%, I(q12) = 12.2%, I(q21) = 7.3% , I(q22) = 12.3%
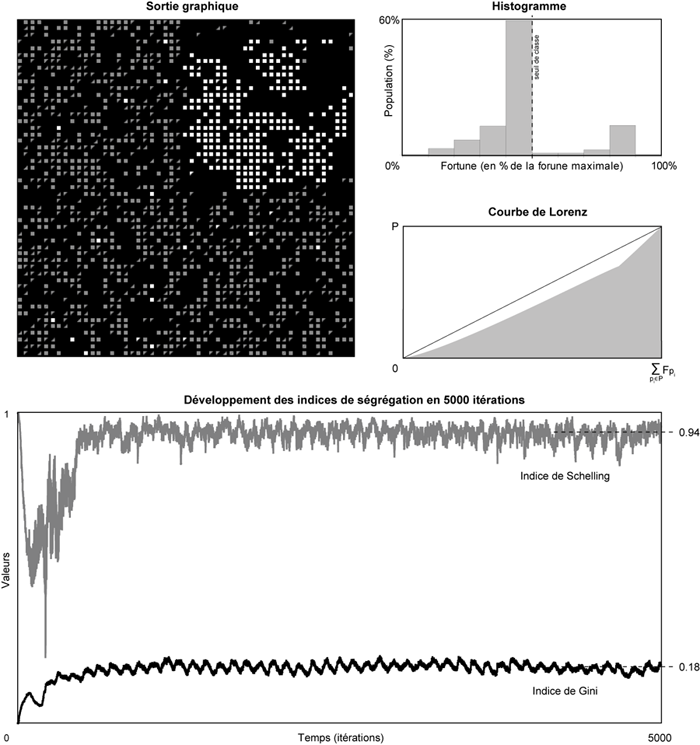
4th simulation — Same parameters as the preceeding figure (3rd simulation). Here, we can observe a concentration of the high-fortune population in only one quarter (q11). The following taxes have been recorded: I(q11) = 5.9%, I(q12) = 11.9%, I(q21) = 11.9%, I(q22) = 11.3% :
PROGRAM NOTES:
This model combines Schelling's spatial segregation model, Epstein&Axtel's SugarScape and a demographc model of dependency between household fertility rates and socio-economical status, in order to illustrate how a spatial segregation pattern can emerge from an initially (socially as well as spatially) homogenous population of households. It also illustrates retroaction of spatial segregation on social polarity as en effect of spatially inhomogeneous taxing mechanisms.
Bibliography
- ANTONI J.-P., Modélisation de l’étalement urbain : une approche méthodologique, Cybergeo, 2002.
- BENENSON I., TORRENS M. P., Geosimulation : Automata-based modeling of urban phenomena, John Wiley and Sons, 2004.
- BIDOU-ZACHARIASEN C., « Gentrification : le tabou français. », Esprit, vol. 3-4, 2004, p. 62-64.
- DAUPHINÉ A., Les théories de la complexité chez les géographes, Anthropos, 2003.
- DELAHAYE J.-P., « La ségrégation urbaine : une fatalité ? », Pour la science, vol. 339, 2006, p. 90-95.
- DONZELOT J., « La ville à trois vitesses : relégation périurbanisation, gentrification », Esprit, vol. 3-4, 2004, p. 14-39.
- DUMONT A., Dépopulation et civilisation : étude démographique, Paris, 1890.
- ENGELEN G.,WHITE R., ULJEE I., « Integrating constrained cellular automata models, GIS and decision support tools for urban planning and policy making », Timmermans H. P. J. (dir.) Decision Support Systems in Urban Planning, , 2002, p. 125-155.
- EPSTEIN J., AXTEL R., Growing Artificial Societies : Social Science from the Bottom Up, Brookings Institution Press., Washington, D.C., 1996.
- OUREDNIK A., La géographie cellulaire. Esquisse d'une épistémologie géographique des automates cellulaires, 2005.
- OUREDNIK A., La philosophie des automates cellulaires, 2004.
- OUREDNIK A., Ségrégation Spatiale des Étrangers en Suisse : D’après les données OFS du recensement de la population 1990, 2004.
- PANCS R., N. V., « Schellig’s spatial proximity model of segregation revisited», Computing in Economics and Finances, 2003.
- PETERSEN W., Population, 3 édition, 1975.
- PRETECEILLE E., Ségrégations Urbaines, L’Harmattan, Paris, 1995.
- SCHELLING T. C., « Dynamic Models of Segregation », Journal of mathematical sociology, vol. 1, 1971, pp. 143-186.
- SCHELLING T. C., Micromotives and Macrobehavior, Norton, New York, 1978.
- SOJA E. W., « Writing the city spatially », City, vol. 7, 2003, p. 270-280.
- WILENSKY U., NetLogo, Center for Connected Learning and Computer-Based Modelling. Northwestern University, Evanston, IL, 1999.