The legend for proportional circles sizes is drawn automatically.
Reprojectiong on the fly from WGS84 to the newly available AirOcean (Dymaxion projection) in D3v5.
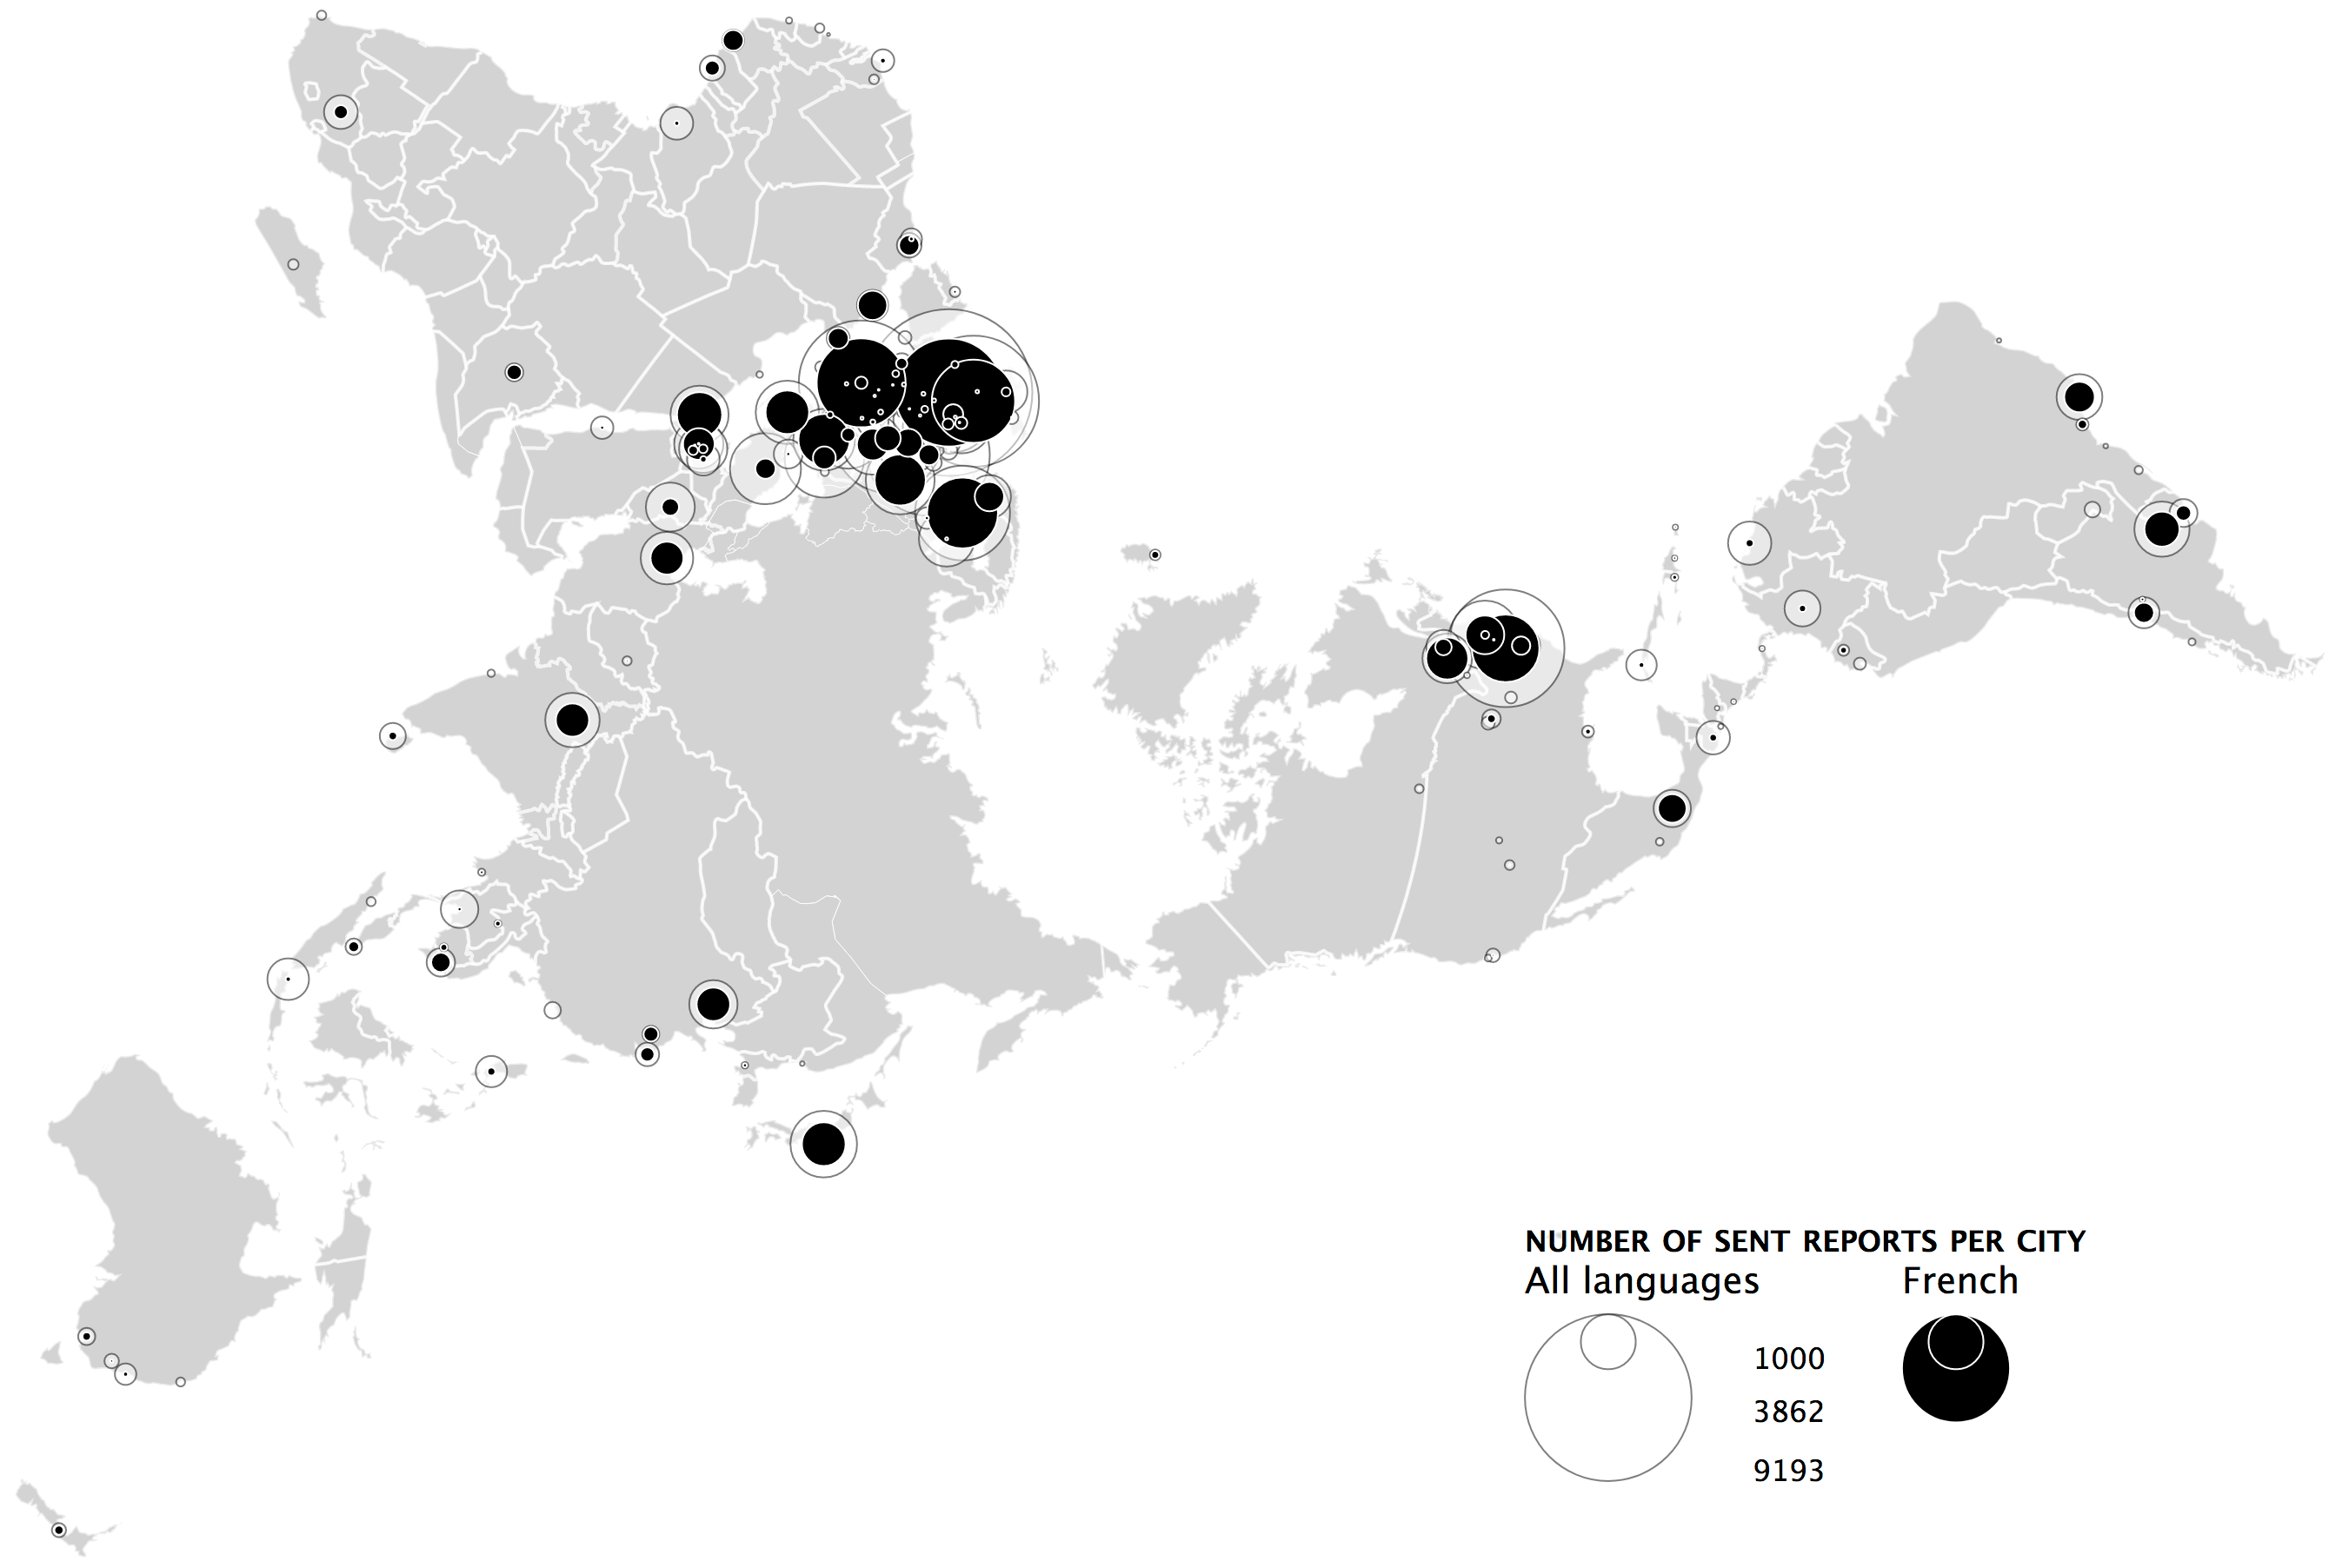
Example data: number of political reports sent by Swiss embasies to Bern in all languages and in French specifically betwee 1920 annd 1960.
Running D3 version of this map is available here.
<!DOCTYPE html>
<meta charset="utf-8">
<style>
.states1920 {
  stroke: white;
  stroke-width: 0.5;
  fill: lightgrey;
}
.states1945 {
  stroke: white;
  stroke-width: 2;
  stroke-opacity:0.5;
  fill: none;
}
.citiesall {
    fill:white;
    stroke:black;
    fill-opacity: 0.5;
    stroke-opacity: 0.5;
}
.citiesselected {
    fill:black;
    stroke:white;
}
.legend{
    font-family: 'Lucida Sans', 'Lucida Sans Regular', 'Lucida Grande', 'Lucida Sans Unicode', Geneva, Verdana, sans-serif;
    font-size: 1.3em;
}
.legendtitle{
    font-variant: small-caps;
    font-weight: bold;
}
.legendscale{
    font-size: 0.8em;
}
</style>
<svg width="1500" height="900"></svg>
<script src="d3/d3.v5.min.js"></script>
<script src="d3/d3-geo.v1.min.js"></script>
<script src="d3/d3-geo-projection.v2.min.js"></script>
<script src="d3/d3-geo-polygon.min.js"></script>
<script>

var svg = d3.select("svg"),
    width = +svg.attr("width"),
    height = +svg.attr("height");

var region = "world"; // can be world or europe.
var legendtranslate = "translate(1000,800)"; // positioning the legend

if (region == "europe") {
    var projection = d3.geoPeirceQuincuncial()
            .scale(1300)
            .translate([0.35*width, -0.35*height])
            .precision(0.1);
    legendtranslate = "translate(100,350)";
} else {
    var projection = d3.geoAirocean()
        .scale(90)
        .translate([0.5*width,0.5*height])
        .precision(0.1);
}

var path = d3.geoPath()
  .projection(projection);

var scaler = 2;

Promise.all([
    d3.json('world_1920.geojson'),
    d3.json('world_1945.geojson'),
    d3.json('citiesallreports.geojson'),
    d3.json('citiesselected.geojson')
]).then(([states1920,states1945,citiesall,citiesselected]) => {
    svg.append("g")
            .attr("class", "states1920")
        .selectAll("path")
            .data(states1920.features)
            .enter().append("path")
            .attr("d", path)
    ;
    svg.append("g")
            .attr("class", "states1945")
        .selectAll("path")
            .data(states1945.features)
            .enter().append("path")
            .attr("d", path)
    ;
    svg.append("g")
            .attr("class", "citiesall")
        .selectAll("circle")
            .data(citiesall.features.sort(function(a, b) { return b.properties.count - a.properties.count; }))
            .enter().append("circle")
            .attr("cx", function (d) { return projection(d.geometry.coordinates)[0]; })
            .attr("cy", function (d) { return projection(d.geometry.coordinates)[1]; })
            .attr("r", function (d) { return Math.sqrt(d.properties.count) /scaler; })
    ;
    svg.append("g")
            .attr("class", "citiesselected")
        .selectAll("circle")
            .data(citiesselected.features.sort(function(a, b) { return b.properties.count - a.properties.count; }))
            .enter().append("circle")
            .attr("cx", function (d) { return projection(d.geometry.coordinates)[0]; })
            .attr("cy", function (d) { return projection(d.geometry.coordinates)[1]; })
            .attr("r", function (d) { return Math.sqrt(d.properties.count) / scaler; })
    ;

    // add a legend -----
    // add maximum circle sizes
    maxcitall = citiesall.features.sort(function(a, b) { return b.properties.count - a.properties.count; })[0].properties.count;
    maxcitsel = citiesselected.features.sort(function(a, b) { return b.properties.count - a.properties.count; })[0].properties.count;
    rmaxcitall = Math.sqrt(maxcitall)/scaler; // prepare circle radidus
    rmaxcitsel = Math.sqrt(maxcitsel)/scaler;
    var legend = svg.append("g").attr("class","legend").attr("transform",legendtranslate);
    legend.append("circle").attr("class","citiesall").attr("r",rmaxcitall); // the center of this one one serves as a reference point for the other elements.  This center is at position 0,0 with respect to the g element, which we have translated
    legend.append("circle").attr("class","citiesall").attr("r",Math.sqrt(1000)/scaler)
        .attr("cy",-(rmaxcitall-Math.sqrt(1000)/scaler))
    ;
    legend.append("text").text("number of sent reports per city")
        .attr("class","legendtitle")
        .attr("x",-rmaxcitall)
        .attr("y",-rmaxcitall-36)
    ;
    legend.append("text").text("All languages")
        .attr("x",-rmaxcitall)
        .attr("y",-rmaxcitall-12)
    ;
    legend.append("text").text("French")
        .attr("x",-(rmaxcitsel) + 200)
        .attr("y",-rmaxcitall-12)
    ;
    legend.append("circle").attr("class","citiesselected").attr("r",rmaxcitsel)
        .attr("cx",200)
        .attr("cy",-(rmaxcitall-rmaxcitsel))
    ;
    legend.append("circle").attr("class","citiesselected").attr("r",Math.sqrt(1000)/scaler)
        .attr("cx",200)
        .attr("cy",-(rmaxcitall-Math.sqrt(1000)/scaler))
    ;

    legend.append("text").text("1000").attr("class","legendscale")
        .attr("x",rmaxcitall+35)
        .attr("y",-rmaxcitall+ Math.sqrt(1000)/scaler*2) // *2 because interested in diameter not radius, here
    ;
    legend.append("text").text(maxcitsel).attr("class","legendscale")
        .attr("x",rmaxcitall+35)
        .attr("y",-rmaxcitall+rmaxcitsel*2)
    ;
    legend.append("text").text(maxcitall).attr("class","legendscale")
        .attr("x",rmaxcitall+35)
        .attr("y",rmaxcitall)
    ;
});
</script>