A peer-reviewed paper based on this short post is available here:
Ourednik, A. (2017). The third dimension of political mapping: exploiting map interactivity for a better understanding of election and referendum results. Cartography and Geographic Information Science, 0(0), 1‑12. https://doi.org/10.1080/15230406.2017.1295820
On December 4th 2016, Austrians will have to renew their Bundespräsidentenwahl. Up to now, there have been two rounds. A first on April 24th, in which the far right candidate Norbert Hofer collected 35.1% of votes and his Green party opponent Alexander Van der Bellen 21.3%, the rest of the votes going to four other candidates. In a second round, in which the Austrians chose only between the first two candidates of the first round, van der Bellen obtained 50.3% of the votes. Hofer’s party, the FPÖ, has contested this result, pointing out irregularities in the vote by correspondence (Briefwahl). The constitutional tribunal of Austria ruled on July 1st that the election needs to be renewed. Initially planned for October 2nd 2016, this re-election has been further postponed by 2 months. Meanwhile, Doris Bures (SPÖ), Karlheinz Kopf (ÖVP) and Norbert Hofer (FPÖ) assume the role of interim collegial presidency.
The FPÖ presents itself as traditionalist and hostile to foreigners and local minorities. Austria’s territory is composed in a large part of Alpine regions. 786’776 of its 8’665’550 inhabitants live in its capital Vienna. A first look on the second election round looks like this:
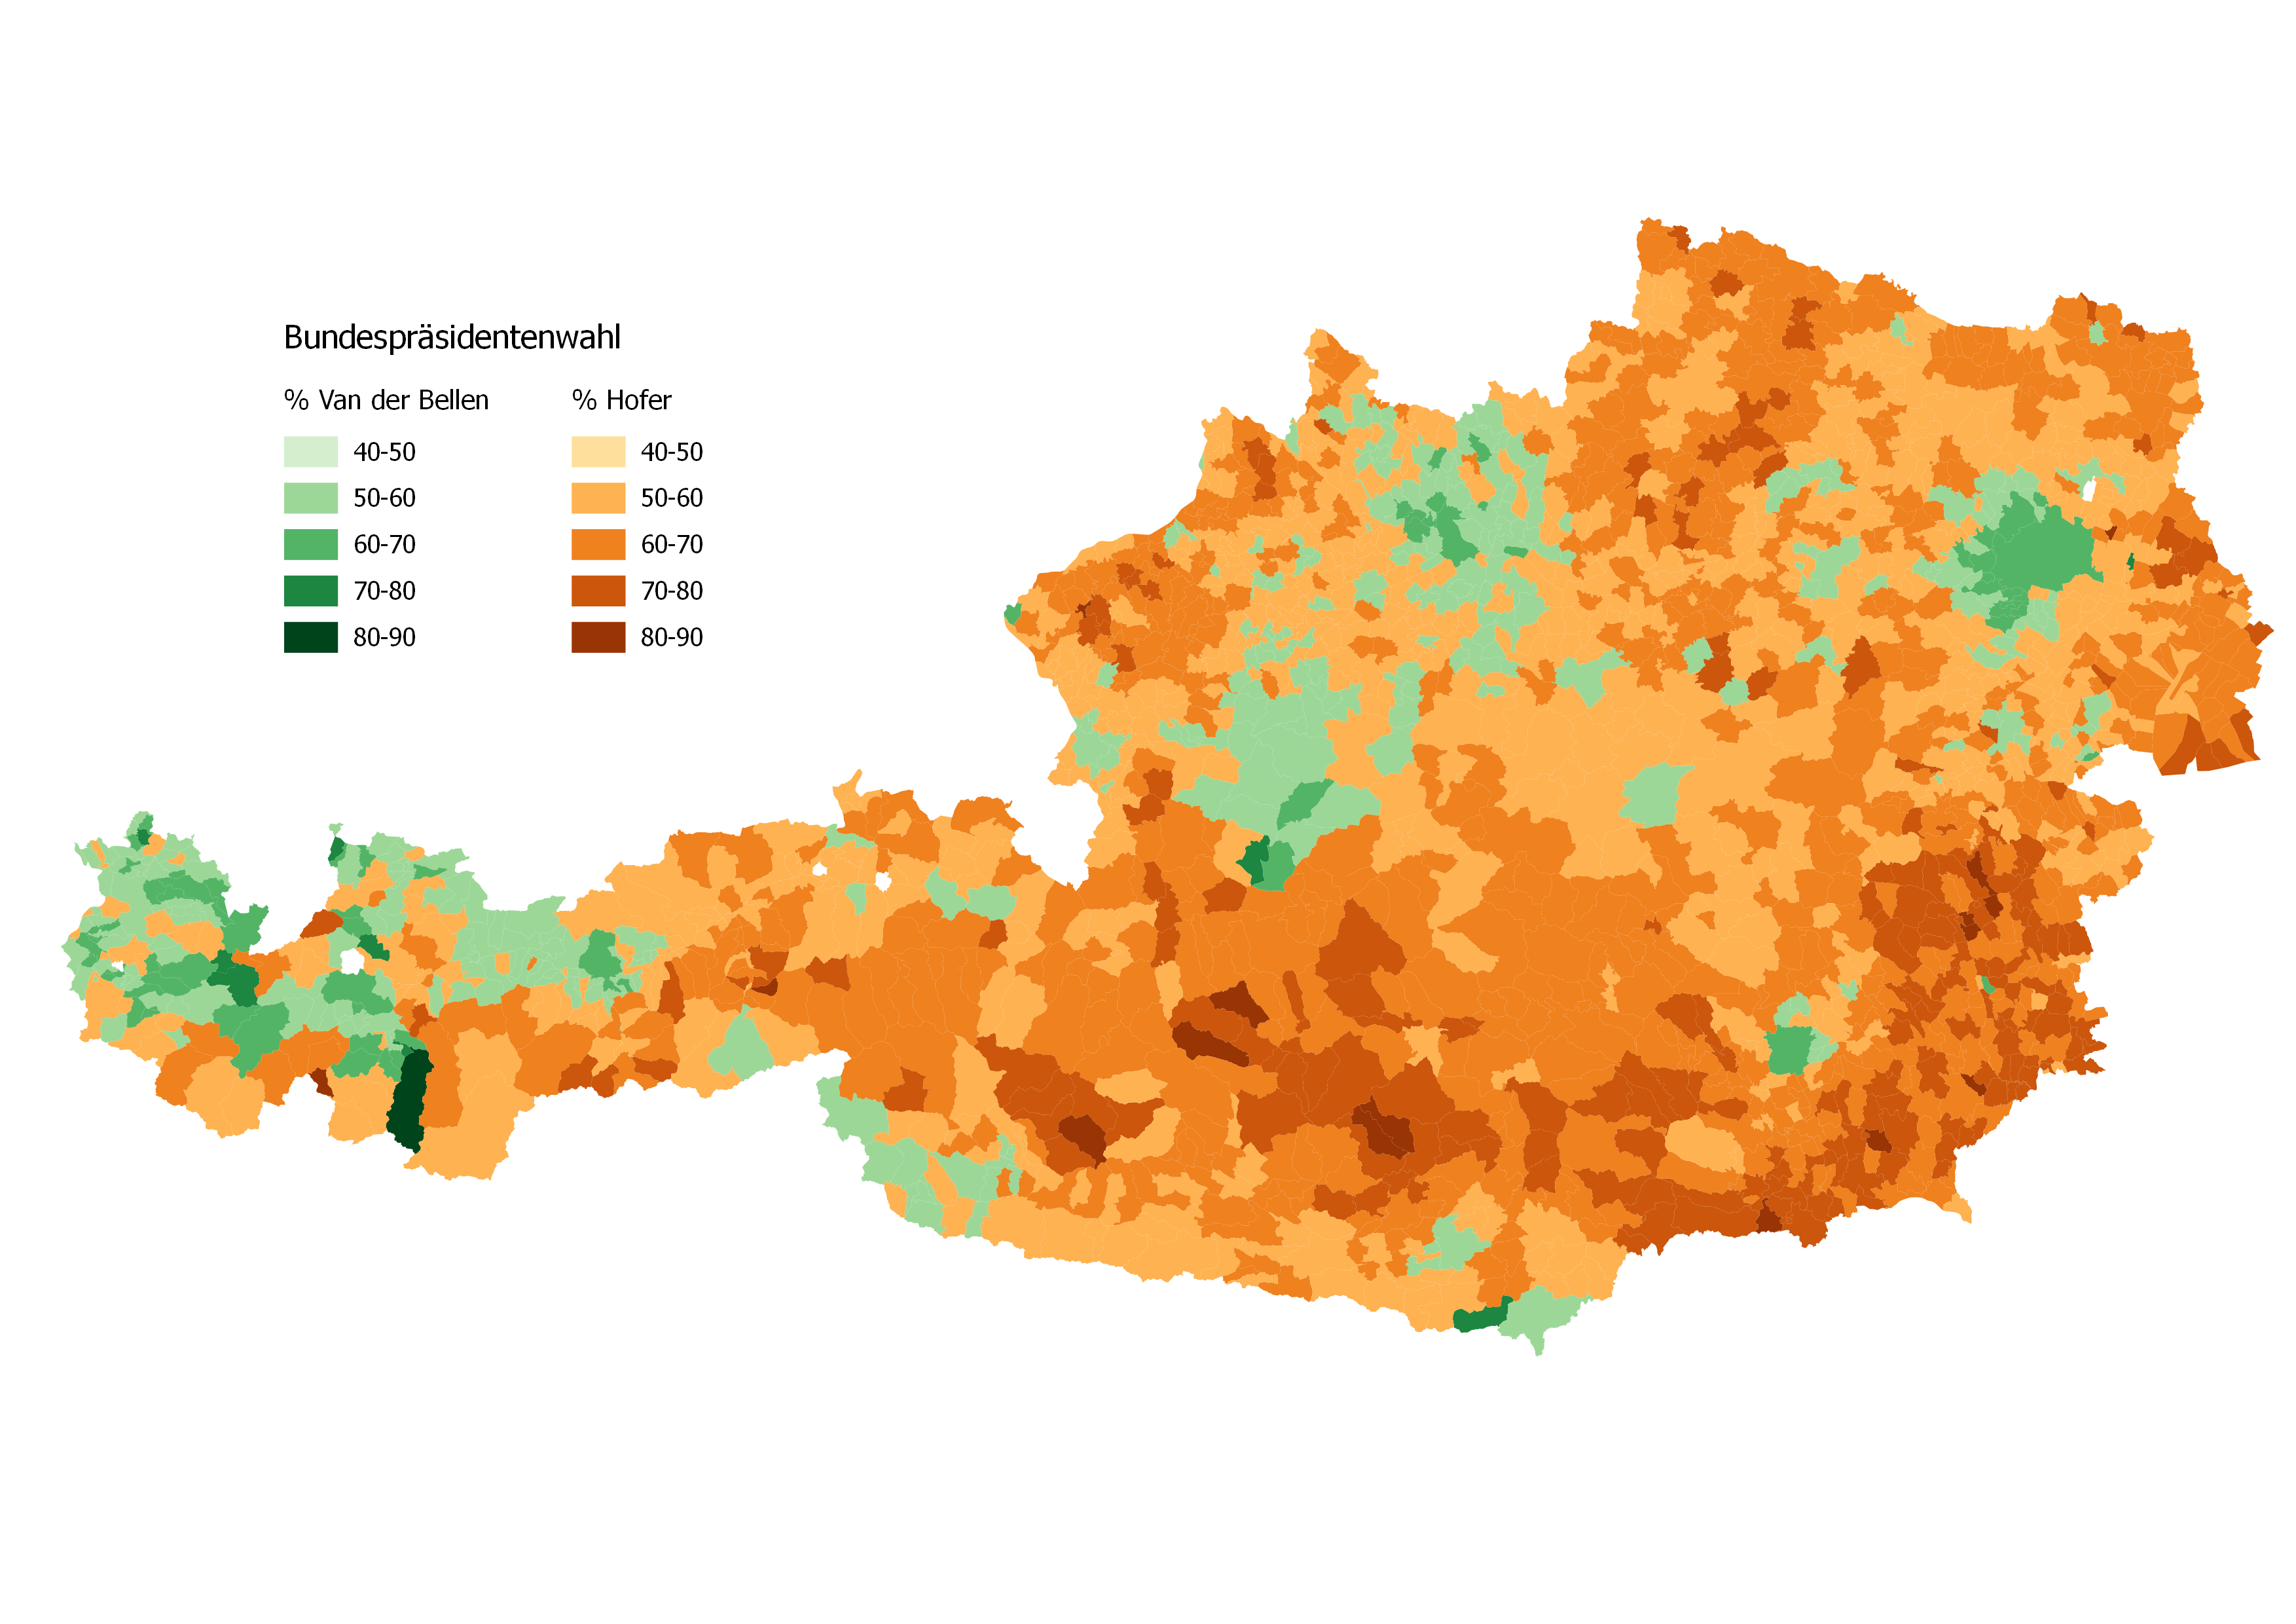
On several occasions, I’ve shown this map to an audience and asked which candidate won. Most answered “Hofer”, for obvious reasons. In fact, this map hardly reflects the electoral result. It is a topographical map. Its surfaces do not relate in any way to the electoral population, but show acres of land surface, including fields and rocks of the Alps. Vienna’s visual importance is proportional to the 415km2 it occupies.

A radically different image appears when you adapt the size of surfaces of the Austrian communes to the number of electors that live in them, for example with the help of ScapeToad:
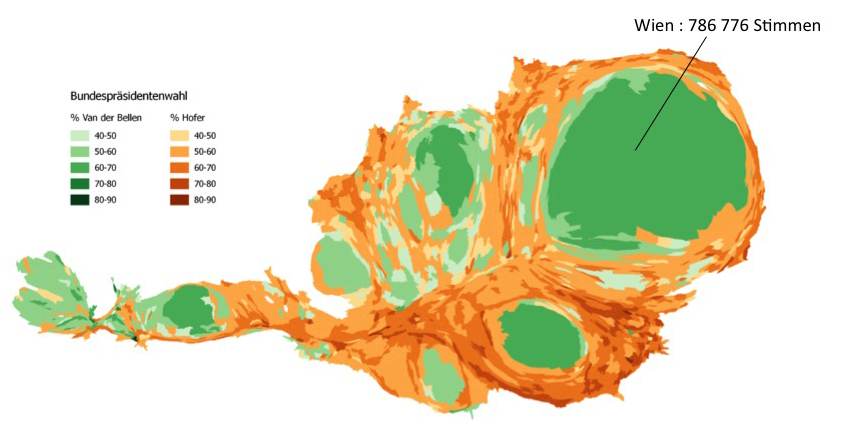
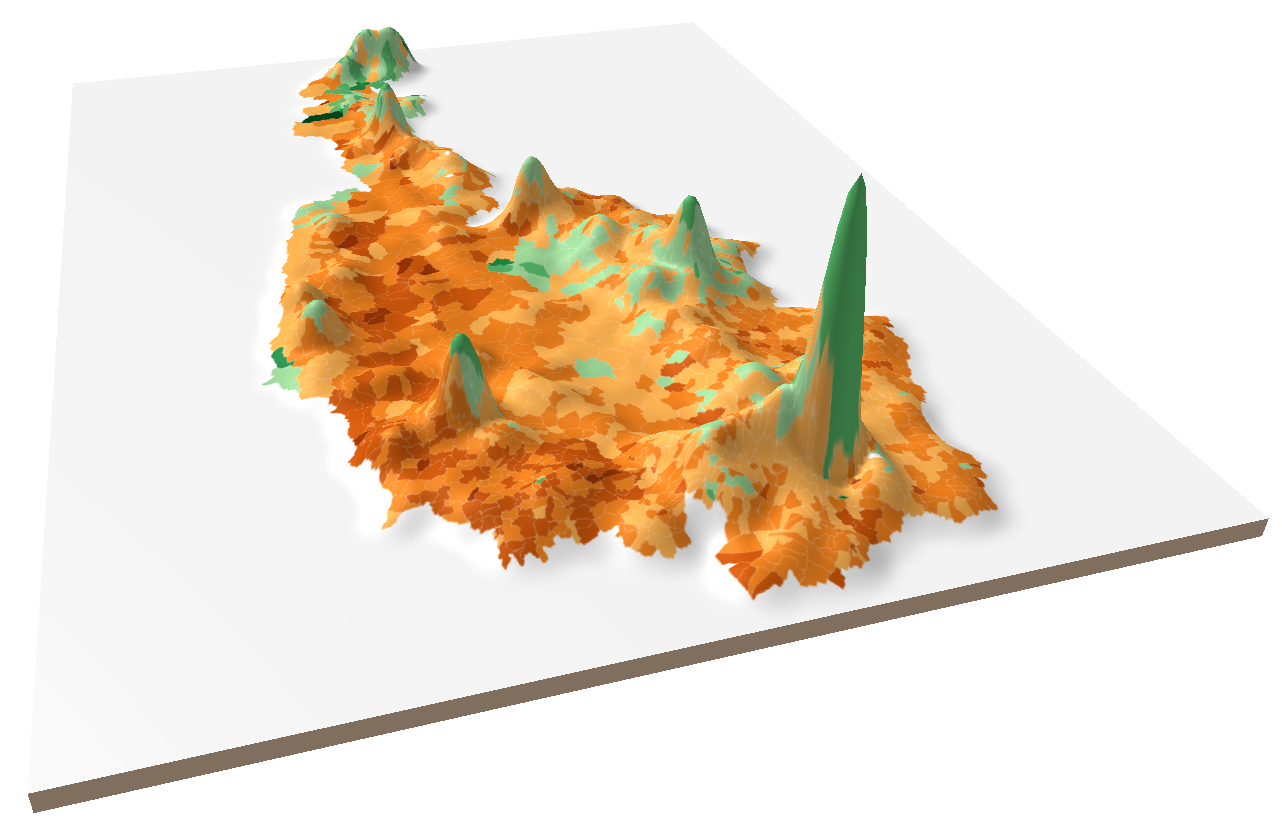
The victory of Van de Bellen suddenly becomes understandable. Many say, though, that this “distorted” image of Austria is hard to read, due to the fact that communes are no longer in their “usual” places; “usual” meaning arranged in the same way as we see them on driving maps or in Google maps. For this reason, I propose a different method. Let’s not change surfaces but map the electors to a third dimension. You obtain the following image:

The heights show the number of electors, stressing the electoral importance of Vienna and other major cities. But the map can also be looked at from above. Thanks to this, and in contrast to the cartogram, the reader is given the possibility to see and identify traditional landmarks:
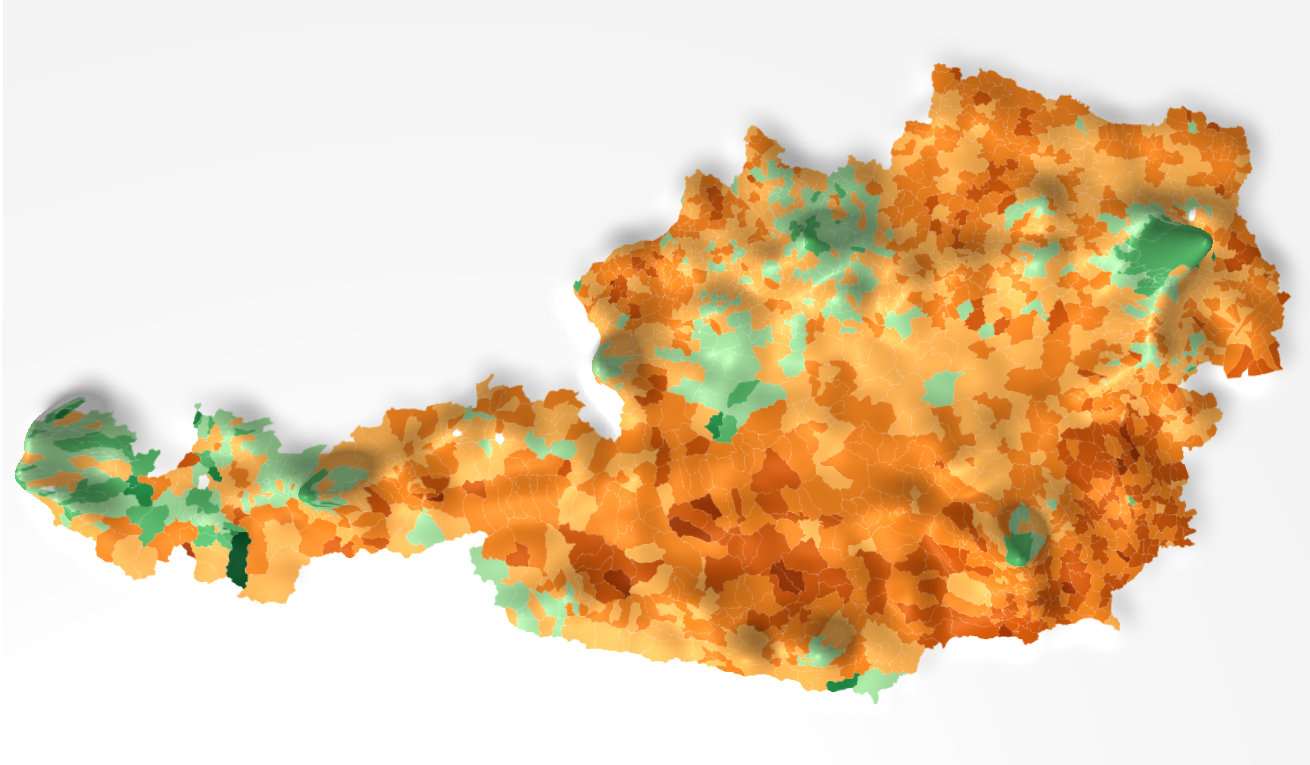
Since I’ve been working with the three.js framework, you can try this out in an interactive version. Move around the image below with your mouse or your fingers on a touch-screen, also in the iframe at the top of this page.
How to ?
To produce these maps, I’ve used qGIS with the qgis2threejs plugin by Minoru Akagi. You can also work directly by exploiting the excellent three.js library as I’ve done in the following example, which needs all in all a hunderd lines of html and javascript code, including the initiation of the overlay image, the rotation and the height multiplication factor.
If you are interested in maps of this kind for your project, do not hesitate to contact me.