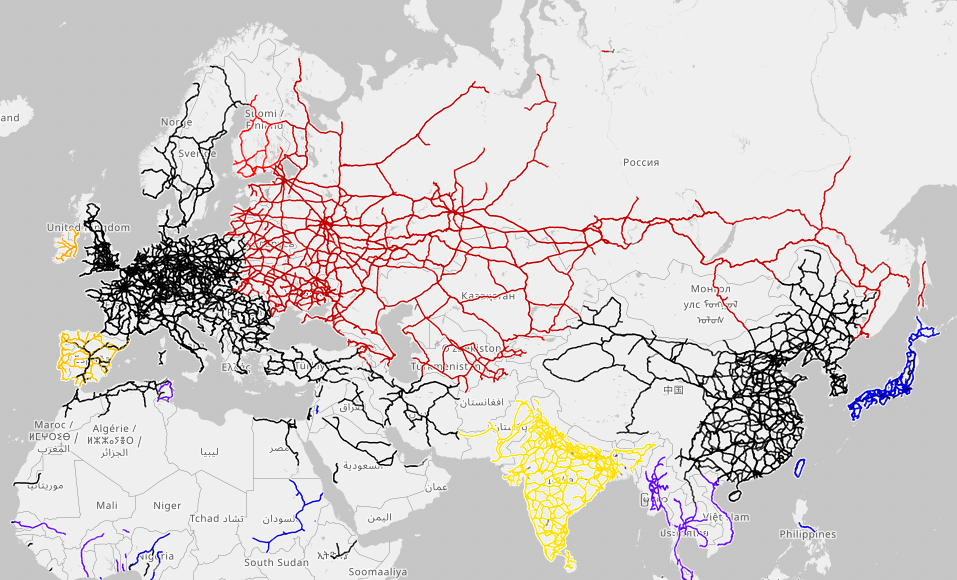
A look at the global map of rail track gauges immediately reminds you of the current invasion of Ukraine. There is a material substrate of the putinist nostalgia of the Muscovite Empire. Far more than a purported linguistic or cultural proximity of the ex-Soviet states, this substrate of steel paves the way for geopolitical ambitions. […]
Category Archives: Maps
Hypertopia: from Utopia to Omniscience
English translation transcript of my conference given in French at the CERN Globe on September 22nd, 2022, and based on the eponymous book from 2019. Tonight, I propose to talk about two ideas, two concepts. The first one you already know: the concept of utopia. The other concept, which I propose to introduce, is the […]
The impossible territory and the maps of the boyar Kraiensky

Figure 1 Overlapping territories of First Nations in the perception of their members. Screenshot from the geomatics site https://native-land.ca/ . Unstable borders are a cartographer’s nightmare. The simple task of reporting on demographic changes quickly becomes a headache in a country whose municipalities merge, divide, and even change their spatial contours according to the projects […]
Text2Landscape: Visualize a Text in Multiple Spaces with R — Force-directed networks, Biofabric, Word Embeddings, Principal Component Analysis and Self-Organizing Maps
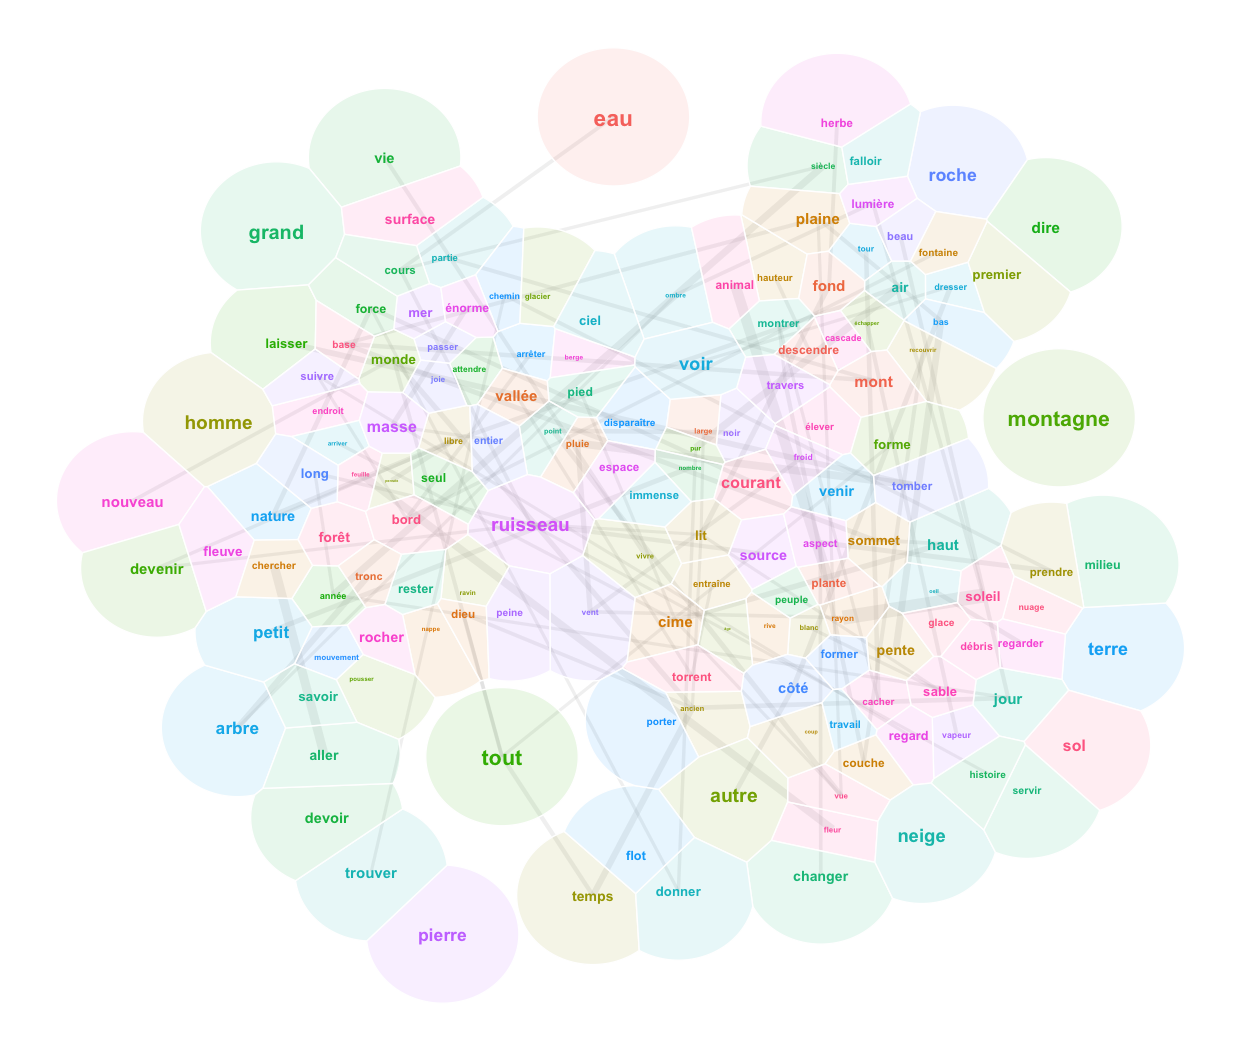
You will find no realistic landscapes prior to the Renaissance. The saints of medieval murals float in a conceptual space informed by hierarchies and symbolic relations; so do those of the Prajñāpāramitā Sūtras. The word “landscape” appears with the Dutch painters of the 15th century. A landscape is a part of the world perceived by […]
Création et analyse de cartes mentales
Les cartes mentales représentent un espace tel qu’il est perçu par les habitants plutôt que tel qu’il est présenté sur les “cartes officielles” (p. ex. les cartes que vous pouvez charger à partir de ressources cantonales ou d’OpenStreetMap). Une carte mentale ne s’inscrira souvent pas dans une vision topographique de l’espace, avec ses coordonnées, sa […]
Ideograph – explore ideologies of political parties with SPAQRL requests to WikiData, D3 and PixiJS.
Ideograph is a visual tool for exploring ideologies of political parties. It queries its data directly from the frequently updated WikiData graph database. You can filter the graph by country, and find further information by clicking on the node labels. Ideograph is licensed under GNU GPL 3.0. Presentation Video I’ve presented IdeoGraph at the Wikidata […]
Mediatized Places in Wuhan – a Cartographic Attempt banned by Facebook
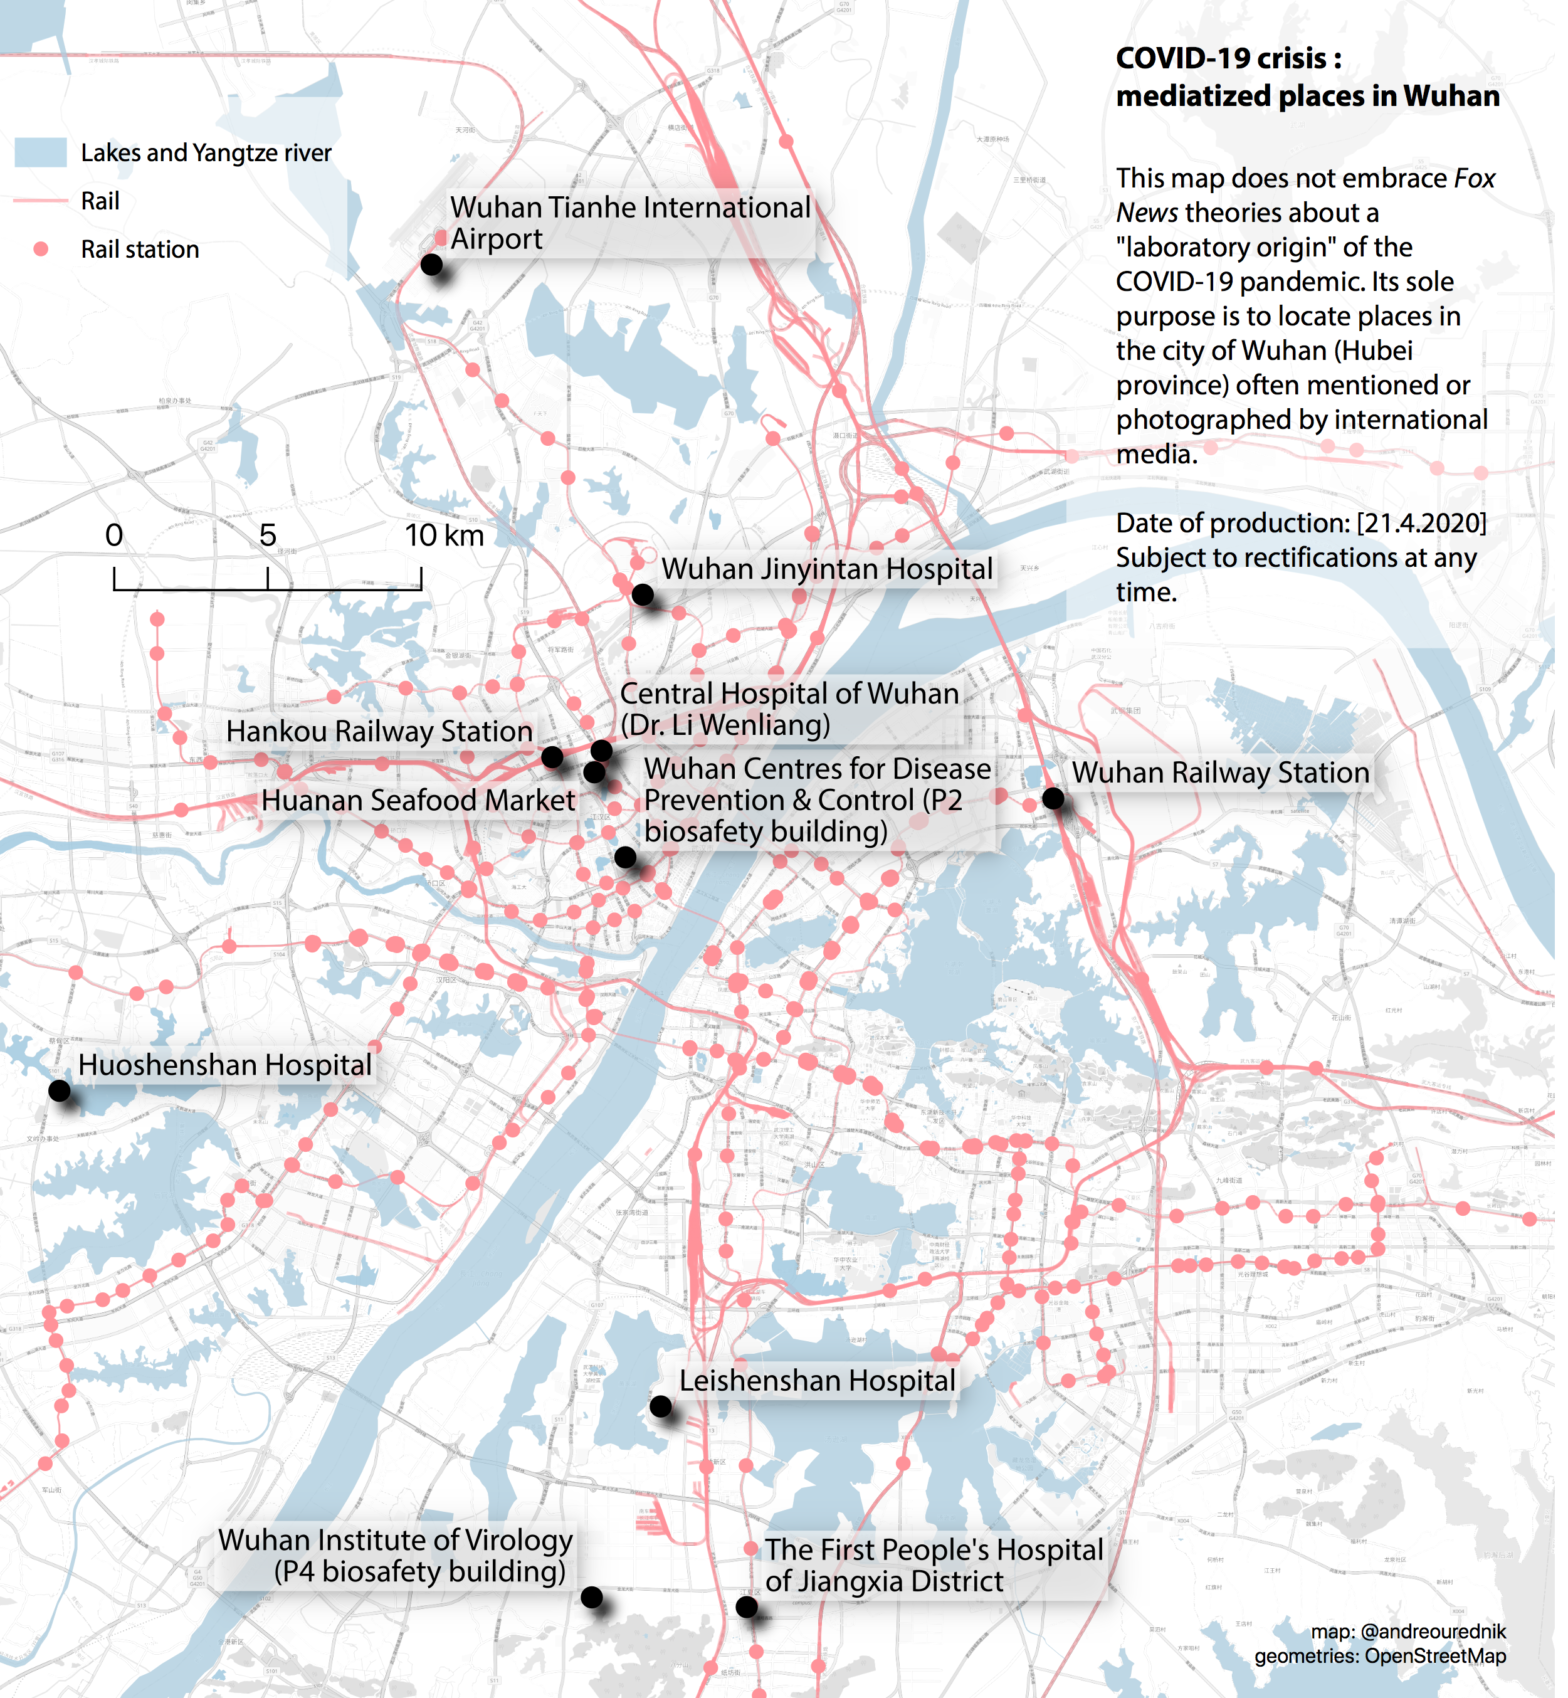
We’ve heared a lot about Wuhan (武汉), during 2020, for obvious reasons. Facts have a hard life on the battlefield of speculations, caught up in crossfire between pro-Trump propaganda channels (FoxNews, OANN, …) and Chinese state media. Scientists propose two hypotheses for the origin of the Covid-19: A zoonotic transmission from animal to human, traced […]
COVID-19 Coronavirus cases in absolute numbers and per capita – evolution
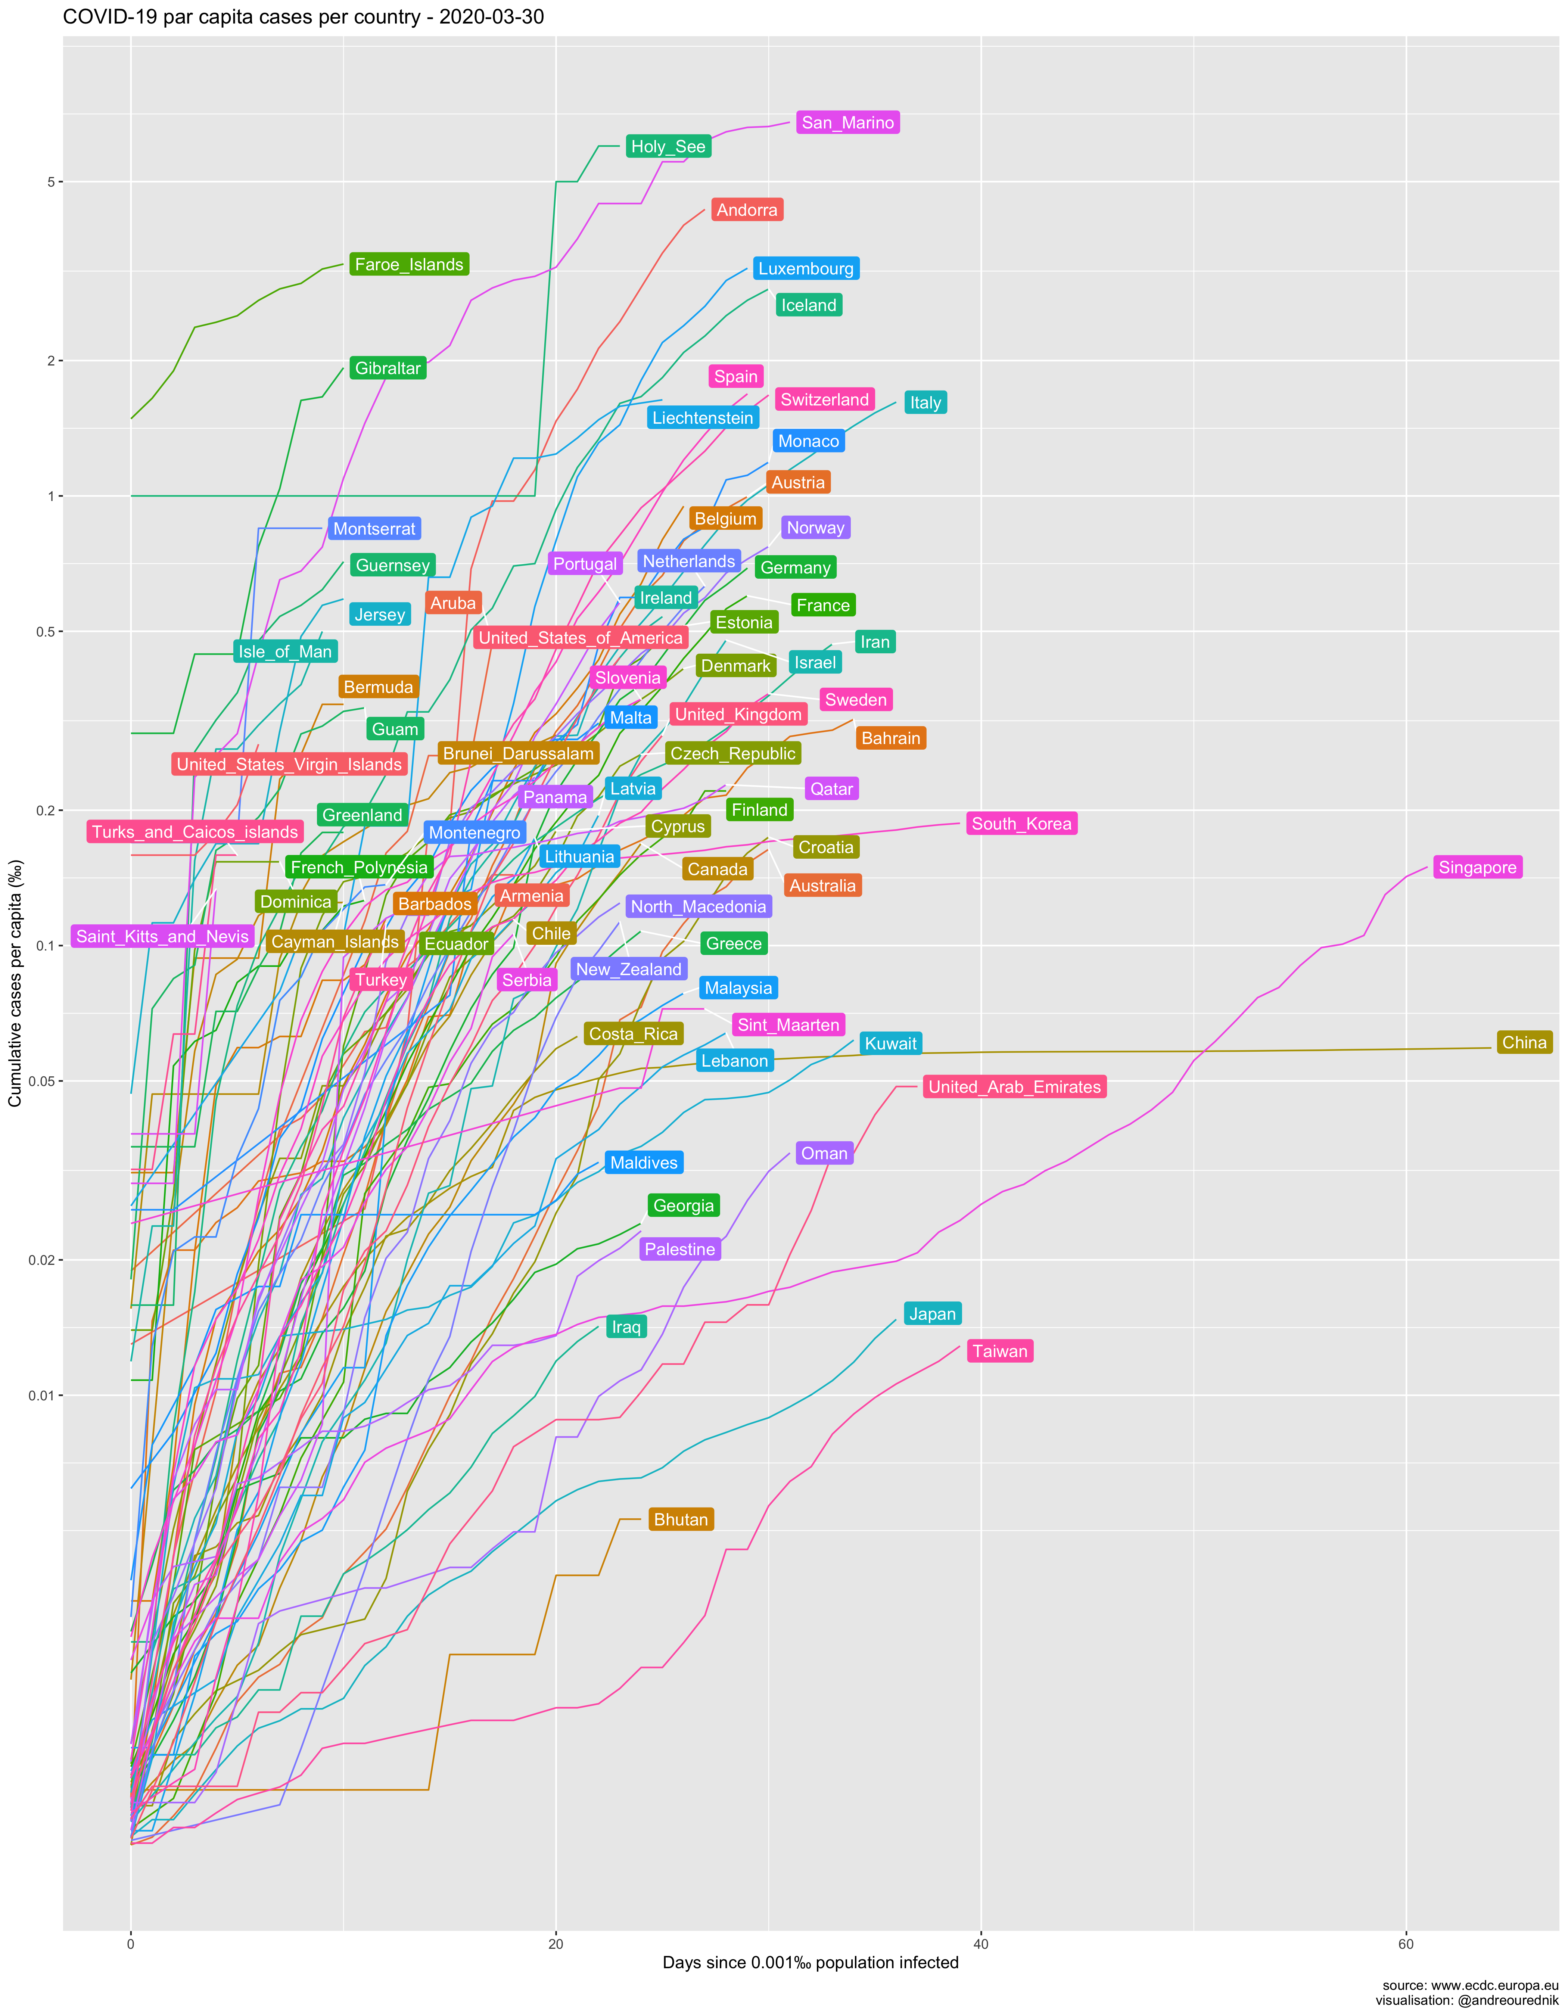
Graphics of the evolution of the COVID-19 pandemic. Updated regularly since March 31st. Source code for graphic production included. Excellent graphics of the evolution of the COVID-19 have been made by John Burn-Murdoch for the Financial Times or by Lisa Charlotte Rost for the Grand Continent (observatoire Coronavirus : tendances globales). Not only use they […]
Draw anything you want with R on the Cartesian grid
Most of the graphics documenation in R is dedicated to high level plotting packages that sometimes remind me of LaTeX: you spend less time producing graphical elements you need than getting rid of elements you have not asked for. Some of these packages are great, of course, and you should definitely use them for well […]
GéoRécits3D : mapping journeys and shared places in a space-time aquarium
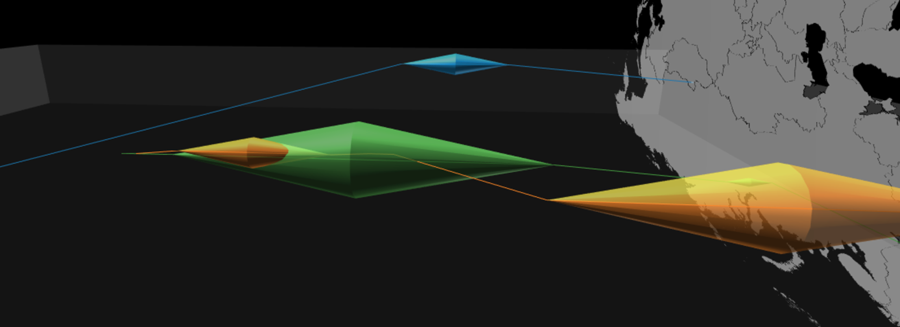
Spatial mobility always involves at least two types of distances: the topographical distance traveled on the surface of the Earth and the time distance taken to do so. GéoRécits3D allows you to map both in a “space-time aquarium” (a cuboid with one dimension dedicated to time). It is written using HTML5 and JavaScript, and uses […]